
Private Markets in 2026: Five Investment Themes Defining a New Era of Opportunity
Selective but opportunity-rich, private markets in 2025 are coalescing around five investable themes—U.S. housing supply, AI-driven energy infrastructure.
Private Markets in 2026: Five Investment Themes Defining a New Era of Opportunity
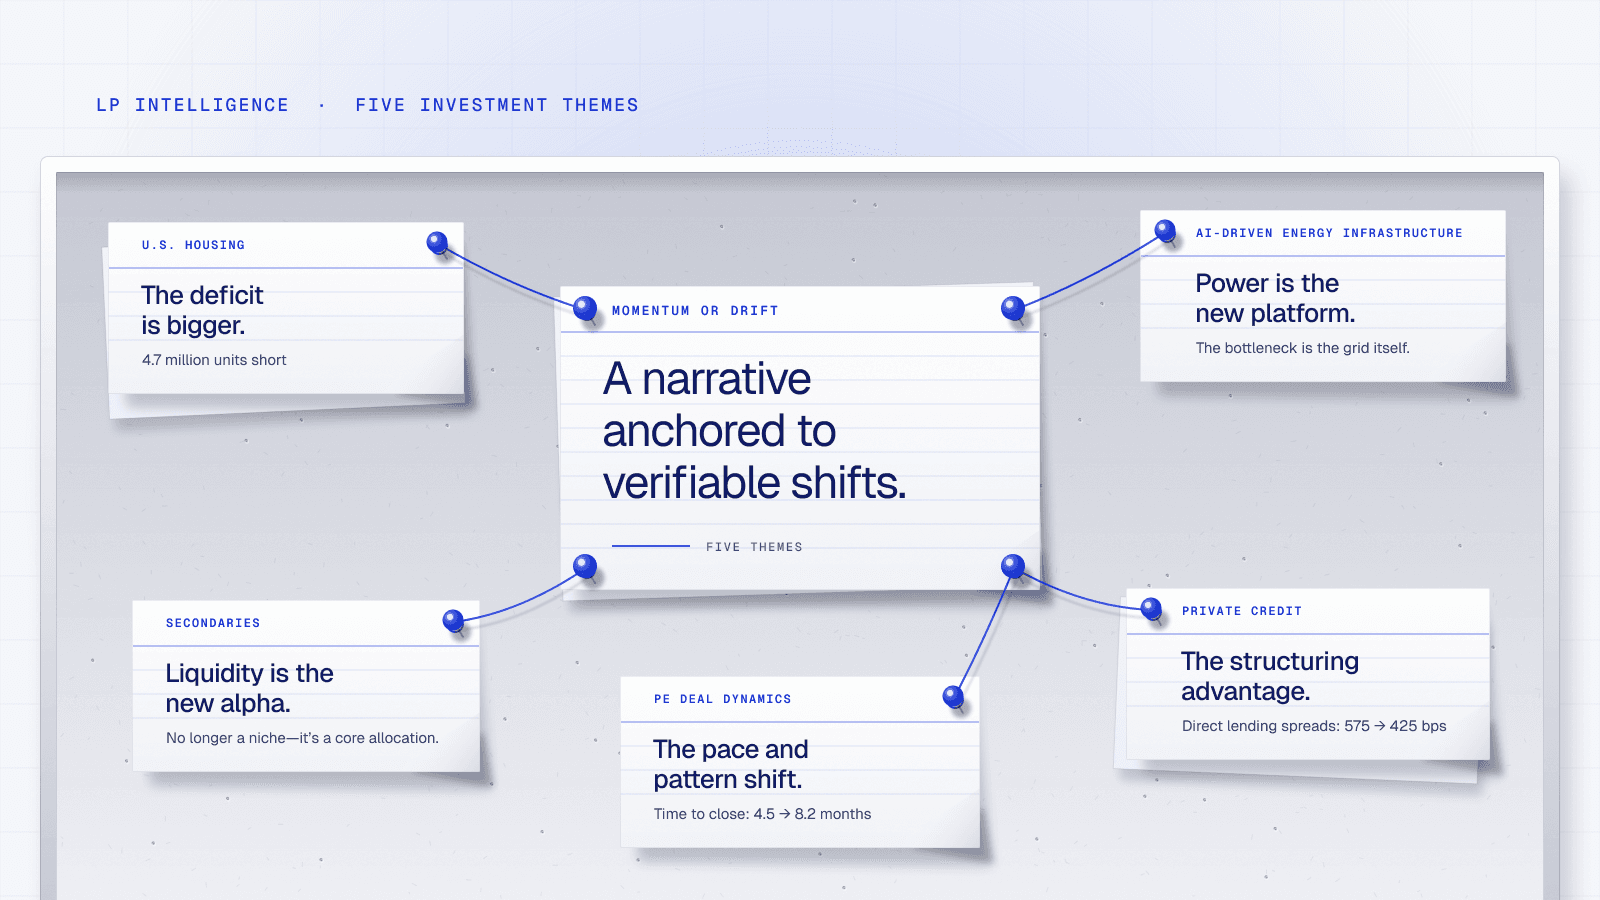
Fundraising in 2026 is selective but far from stalled. The difference between momentum and drift is whether your narrative is anchored to verifiable shifts—housing supply, data-center power, secondaries liquidity, private credit structuring, and the pace and pattern of PE deals. The following five themes are the ones allocators are leaning into now, backed by the latest data and signals. For each, you’ll find the investor takeaway and exactly how to operationalize it with Altss so the story converts to meetings and commitments.
1) U.S. Housing: The Deficit Is Bigger—and More Uneven—Than Headlines Suggest
The national housing shortfall reached 4.7 million units in 2023 and widened again despite a construction surge, with an estimated 8.1 million people living “doubled up.” In July and August updates, Zillow and the Harvard Joint Center for Housing Studies (JCHS) reinforce that the shortage persists even as new supply cools price growth in some metros. Half of U.S. renters—22.6 million households—were cost-burdened in 2023, the third consecutive record, and affordability stress is becoming more geographically uneven. In July, Zillow reported home values rising in roughly half the country and falling in the other half, a sign that local supply/demand imbalances—not a uniform national cycle—are driving outcomes.
The investor implication is straightforward: durable NOI growth is most likely where structural undersupply meets pro-build policy and resilient demand (workforce housing, attainable rent tiers, senior housing). JCHS notes that insurance and property tax burdens are rising fastest in climate-exposed regions, intensifying the need to underwrite risk and resilience at the sub-market level rather than by broad region.
The Geography of Opportunity
Consider the divergence between Phoenix and Austin. Phoenix added 45,000 housing units in 2024, but net migration added 120,000 people—a 3:1 ratio of people to homes. Austin, by contrast, added 60,000 units against 80,000 new residents, narrowing its gap. The Altss platform tracks these dynamics at the MSA level, using continuously refreshed permit data from the Census Bureau and jobs data from the Bureau of Labor Statistics. Fund managers targeting workforce housing in Phoenix can point to a specific deficit: 75,000 missing units at current population growth rates.
In the Northeast, the story is different. Boston’s housing production has averaged 4,500 units annually over the past decade, but the city needs 15,000 per year to meet demand, according to the Boston Planning & Development Agency. The gap is widest in the $1,200–$1,800 rent tier, where vacancy rates have fallen below 2%. Altss data shows that 14 of the 20 largest U.S. metros have negative jobs-to-permits ratios—more jobs created than housing permits issued—creating a structural tailwind for rent growth in those markets.
The Senior Housing Angle
Senior housing is emerging as a distinct sub-theme within the housing deficit. The 75+ population in the U.S. will grow by 50% between 2024 and 2034, according to the Census Bureau. Yet senior housing construction starts in 2025 were at their lowest level since 2011, per NIC MAP. The result: occupancy rates at independent living and assisted living facilities hit 88.7% in Q2 2026, up from 83.2% in Q2 2023. Rent growth is running at 5.1% year-over-year, outpacing conventional multifamily.
Altss edge: Use Altss to filter LPs with real-estate allocations above a threshold (e.g., >15%) who have a track record in workforce or affordable housing, then overlay “signal” filters for metros with widening jobs-to-permits gaps or newly enacted pro-supply zoning. Pair municipal pensions and housing-focused family offices with developers and proptech GPs in one connection network so outreach is driven by a clear “why now” (e.g., a city’s shortage index moving the wrong way in Q2).
2) AI-Driven Energy Infrastructure: Power Is the New Platform
Power systems are becoming the gating factor for AI—and a catalyst for investment. In the last few weeks, multiple sources converged on the same picture: U.S. data-center construction hit a record annualized pace of $40 billion in June; U.S. electricity demand growth is running well above trend on the back of data-center load; capacity prices in PJM have spiked to the cap for 2026–27 as that system forecasts ~30 GW of data-center-driven demand by 2030. Europe, meanwhile, is racing to relieve grid bottlenecks and re-route data-center siting to grids with headroom.
The IEA’s mid-year update (July 30) shows U.S. electricity consumption set to grow ~2.3% in 2025—more than double the decade average of 1.1%. By 2027, the IEA projects U.S. data-center power demand alone will reach 150 TWh, up from 80 TWh in 2023. That’s the equivalent of adding a New York State’s worth of electricity consumption in four years.
The Asset Class Tectonics
This demand is reshaping private-market investment across multiple asset classes:
Renewable energy infrastructure. Solar and wind farms are being built at record pace, but interconnection queues are growing faster. The Lawrence Berkeley National Lab reports that 2,200 GW of generation and storage were waiting in interconnection queues at the end of 2025, up from 1,400 GW a year earlier. The bottleneck is the grid itself. Fund managers who can underwrite grid-edge investments—battery storage, microgrids, transmission upgrades—are finding receptive LPs.
Natural gas and nuclear. The surge in data-center demand is reviving interest in baseload power. In April 2026, Amazon Web Services announced a $650 million deal with Talen Energy to power its data centers from the Susquehanna Steam Electric Station, a nuclear plant in Pennsylvania. In May, Google signed a 500 MW power purchase agreement with a combined-cycle gas plant in Ohio. The message: hyperscalers are no longer willing to wait for renewables alone.
Data-center REITs and developers. The sector is consolidating. In February 2026, Digital Realty Trust acquired a 1.5 GW development pipeline from CyrusOne for $3.2 billion. In July, Equinix announced a $1 billion joint venture with a sovereign wealth fund to build data centers in Southeast Asia. The returns are attractive: data-center REITs have delivered a 12.4% annualized total return over the past three years, compared to 6.8% for the broader REIT index.
The European Angle
Europe faces a different set of challenges. Grid congestion in Ireland, the Netherlands, and Germany is forcing data-center developers to wait 4–7 years for interconnection. In response, the European Commission in June 2026 proposed a “Grid Action Plan” that would streamline permitting for data-center connections and prioritize sites near renewable generation. The investment opportunity is in grid modernization—a market that McKinsey estimates at €55 billion annually through 2030.
Altss edge: Filter for LPs with dedicated infrastructure allocations exceeding $500 million and a track record in energy or power. Use Altss’s signal filters to identify those who have recently hired energy specialists or attended industry conferences like the Edison Electric Institute Annual Convention. Pair them with GPs who have a clear thesis on grid-edge infrastructure or data-center power solutions. The narrative should be specific: not “AI is driving energy demand,” but “PJM capacity prices are up 400% year-over-year, creating a 25% IRR opportunity in battery storage in the Mid-Atlantic.”
3) Secondaries: Liquidity Is the New Alpha
The secondaries market is no longer a niche—it’s a core allocation. Global secondaries volume reached $132 billion in 2025, up from $93 billion in 2024, according to Evercore. The trend is accelerating in 2026: Q1 volume hit $38 billion, a record for any quarter. The drivers are well-known: LPs need liquidity, and GPs need to extend fund lives. But the composition of the market is shifting in ways that create new opportunities.
The Rise of GP-Led Transactions
GP-led secondaries accounted for 38% of total volume in 2025, up from 25% in 2022. These are transactions where the GP initiates a restructuring of an existing fund, often creating a continuation vehicle that allows the GP to hold onto high-performing assets while offering LPs an exit. The trend is being driven by two forces: the maturity of the PE vintage cycle (funds raised in 2017–2019 are now 7–9 years old) and the difficulty of raising new funds in a selective market.
Notable examples from 2026 include:
- Hellman & Friedman’s $4.5 billion continuation fund for its stake in HubSpot (closed March 2026). The deal allowed H&F to retain a high-growth asset while giving its 2018-vintage fund LPs a 2.1x multiple on invested capital.
- Bain Capital’s $3.2 billion continuation vehicle for a portfolio of healthcare companies (closed June 2026). The transaction was oversubscribed by 40%, signaling strong demand for high-quality GP-led deals.
- Silver Lake’s $2.8 billion tender offer for its stake in Endeavor (closed July 2026). The deal was structured as a single-asset continuation fund, a structure that is becoming more common as GPs seek to hold onto trophy assets.
The LP Perspective
For LPs, secondaries offer a way to manage portfolio concentration, generate liquidity, and access high-quality assets at a discount. The average discount on GP-led transactions in 2025 was 7%, down from 12% in 2023, as competition for deals intensified. But discounts vary widely by asset quality: top-quartile assets trade at or above NAV, while bottom-quartile assets trade at 15–20% discounts.
The Altss platform tracks secondaries activity at the fund level, using continuously refreshed data from placement agents, fund administrators, and public filings. Fund managers can use this data to identify LPs who are actively selling secondaries (a sign they need liquidity) or buying them (a sign they have dry powder).
The Emerging GP Opportunity
For emerging GPs, secondaries are a double-edged sword. On one hand, they compete for LP capital. On the other hand, they offer a way to build a track record. A growing number of emerging managers are raising dedicated secondaries funds, targeting the $200 billion in unrealized PE assets that are sitting in funds past their original term.
In April 2026, a team of former Hamilton Lane professionals raised a $450 million secondaries fund focused on GP-led transactions in the lower middle market. The fund was oversubscribed, with commitments from six family offices and two endowments. The pitch: smaller GP-led deals (under $100 million) are less competitive and offer higher discounts.
Altss edge: Use Altss to identify LPs who have allocated to secondaries in the past 12 months, then segment by type (pension, endowment, family office). For emerging GPs raising a secondaries fund, target LPs who have a track record of backing first-time funds in this space. The narrative should emphasize the structural tailwinds: 40% of PE funds are past their original term, and LPs need solutions.
4) Private Credit: The Structuring Advantage
Private credit is the largest asset class in private markets, with $2.1 trillion in AUM globally as of mid-2026, up from $1.7 trillion at the end of 2024, according to Preqin. But the market is maturing, and the easy returns are gone. The average spread on direct lending deals has compressed from 575 bps over SOFR in 2023 to 425 bps in 2026. The winners going forward will be those who can structure deals that offer downside protection, not just yield.
The Three Pillars of Structuring
1. Covenant-lite is no longer standard. In 2024, 85% of direct lending deals were covenant-lite, meaning they had no financial maintenance covenants. That number dropped to 65% in the first half of 2026, as lenders gained negotiating power. Fund managers who can underwrite deals with meaningful covenants—minimum EBITDA, maximum leverage, asset coverage ratios—will have a competitive advantage.
2. Unitranche is giving way to bifurcated structures. Unitranche loans, which combine senior and subordinated debt into a single facility, were popular in 2021–2023 because they offered speed and simplicity. But they also concentrated risk. In 2026, more deals are being structured as a senior secured tranche (at SOFR + 350 bps) and a junior unsecured tranche (at SOFR + 700 bps). This allows LPs to choose their risk/return profile.
3. Asset-based lending is growing. ABL now accounts for 22% of private credit origination, up from 15% in 2023. The appeal: loans are secured against hard assets (receivables, inventory, equipment) rather than cash flows. Default rates on ABL are lower (1.2% vs. 2.8% for cash-flow lending) and recovery rates are higher (85% vs. 60%).
The Sectoral Rotation
Private credit is rotating away from technology and toward more asset-heavy sectors. In 2025, technology accounted for 35% of direct lending origination; in 2026, it’s 28%. The shift is being driven by two factors: the slowdown in tech M&A and the higher default rates in tech (3.5% in 2025 vs. 1.8% for industrials).
The winners are:
- Healthcare services. Dental practices, veterinary clinics, and outpatient surgery centers are attractive because they have recurring revenue and high barriers to entry. In March 2026, Ares Management closed a $1.2 billion direct lending facility for a portfolio of 150 dental practices. The deal was structured with a 1.5x debt-to-EBITDA ratio and a minimum EBITDA covenant.
- Industrial distribution. Companies that distribute essential parts and equipment (electrical, plumbing, HVAC) have stable cash flows and low correlation to the economic cycle. In May 2026, Golub Capital originated a $750 million unitranche facility for a national electrical distributor. The deal priced at SOFR + 450 bps, with a 50 bps step-up if leverage exceeded 3.5x.
- Insurance-linked securities. ILS is a small but fast-growing segment of private credit, with $150 billion in outstanding securities. The returns are attractive: the Swiss Re Global Cat Bond Index returned 11.2% in 2025. The risk is tail events, but diversification across perils and geographies reduces volatility.
The LP Due Diligence Shift
LPs are getting more sophisticated in their private credit due diligence. In a survey by Proskauer in June 2026, 72% of LPs said they now require GPs to provide granular portfolio data, including loan-level performance, covenant compliance, and recovery rates. Only 45% said the same in 2023.
The Altss platform supports this shift by providing continuously refreshed data on private credit fund performance, including IRR quartile rankings, distribution yields, and default rates. Fund managers can use this data to benchmark their performance against peers and to demonstrate their structuring advantage to LPs.
Altss edge: Filter for LPs with private credit allocations exceeding $200 million and a track record of backing first-time funds in the space. Use Altss’s signal filters to identify those who have recently hired credit analysts or attended industry events like the Private Credit Summit. Pair them with GPs who have a clear thesis on asset-based lending or healthcare services. The narrative should emphasize structure over yield: not “we offer 12% returns,” but “our loans have a 1.8x debt-to-EBITDA ratio and a 90% recovery rate.”
5) PE Deal Dynamics: The Pace and Pattern Shift
Private equity deal activity is recovering, but the pattern is different from previous cycles. Global PE deal value reached $1.2 trillion in 2025, up from $1.0 trillion in 2024, but still below the $1.8 trillion peak in 2021. The recovery is being driven by three factors: falling interest rates, stabilizing valuations, and the need for GPs to deploy dry powder.
The Pace of Deals
The average time to close a PE deal has increased from 4.5 months in 2021 to 8.2 months in 2026, according to S&P Global. The reasons are straightforward: more regulatory scrutiny (particularly in healthcare and technology), longer due diligence periods (especially for ESG and cybersecurity), and the need for more complex financing structures.
This has implications for fund managers. GPs who can demonstrate a repeatable process for closing deals quickly—through pre-sourced pipelines, proprietary diligence frameworks, or captive financing—will have a competitive advantage. LPs are increasingly asking about “deal velocity” in due diligence.
The Pattern of Deals
The composition of PE deals is shifting in three ways:
1. Add-on acquisitions are dominant. Add-ons accounted for 68% of all PE deals in 2025, up from 55% in 2020. The logic is straightforward: buying a platform company and then adding smaller tuck-ins is less risky than a standalone buyout. The Altss platform tracks add-on activity at the fund level, allowing LPs to see which GPs are creating value through consolidation vs. organic growth.
2. Minority investments are growing. Minority deals (where the GP takes a non-controlling stake) accounted for 22% of PE deal value in 2025, up from 15% in 2020. The trend is being driven by family-owned businesses that want growth capital but not a full exit, and by technology companies that want strategic partners. In June 2026, General Atlantic made a $400 million minority investment in a family-owned industrial company in Germany, valuing it at $2.5 billion.
3. Cross-border deals are recovering. Cross-border PE deal value reached $320 billion in 2025, up from $250 billion in 2024, but still below the $450 billion peak in 2021. The recovery is concentrated in two corridors: U.S. to Europe (where valuations are lower) and U.S. to Asia (where growth is higher). In April 2026, KKR acquired a Japanese healthcare company for $1.8 billion, its largest deal in Asia in three years.
The Sectoral Focus
The sectors attracting the most PE interest in 2026 are:
- Healthcare services. The sector accounted for 22% of PE deal value in 2025, up from 18% in 2020. The drivers are demographic tailwinds (aging population), regulatory stability (the Affordable Care Act is now settled law), and fragmented markets (dental, veterinary, home health).
- Technology. The sector accounted for 28% of PE deal value in 2025, down from 35% in 2021. The decline is due to higher valuations and slower growth in software. But cybersecurity and AI infrastructure are bright spots. In May 2026, Thoma Bravo acquired a cybersecurity company for $2.3 billion, paying 12x EBITDA.
- Industrials. The sector accounted for 18% of PE deal value in 2025, up from 15% in 2020. The drivers are reshoring, infrastructure spending, and the need for automation. In February 2026, Clayton Dubilier & Rice acquired a manufacturer of industrial pumps for $1.5 billion, with a plan to add bolt-on acquisitions.
The LP Perspective
LPs are becoming more discerning about PE allocations. In a survey by Coller Capital in June 2026, 58% of LPs said they plan to increase their PE allocation in the next 12 months, but 72% said they are more selective about which GPs they back. The key criteria: track record (70% said it’s the most important factor), sector expertise (55%), and deal sourcing (45%).
Altss edge: Use Altss to identify LPs who are actively deploying capital in PE, then segment by sector preference. For GPs with a healthcare focus, target LPs who have allocated to healthcare PE in the past 24 months. Use Altss’s signal filters to identify LPs who have recently attended industry conferences or hired healthcare specialists. The narrative should emphasize repeatability: not “we found a great deal,” but “our sourcing platform generates 200 proprietary deals per year, and our diligence framework allows us to close within 60 days.”
6) The LP Data Revolution: How Altss Is Changing Fundraising
Underlying all five themes is a structural shift in how LPs make decisions. The era of relationship-driven fundraising is giving way to data-driven allocation. LPs are using platforms like Altss to screen GPs, benchmark performance, and monitor portfolio risk in real time. The implications for fund managers are profound.
The Data Stack
The modern LP data stack includes:
- Fund performance data. IRR, TVPI, DPI, and quartile rankings for thousands of funds.
- Portfolio company data. Revenue growth, EBITDA margins, and debt levels for the companies in a fund’s portfolio.
- Team data. Track records of individual partners, including co-investment history and exits.
- Market data. Benchmarking against peers, including sector, geography, and vintage year.
Altss provides all of this in a single platform, with a sub-30-day update cycle on LP data. The platform tracks 30,000+ institutional investors, RIAs, and family offices, and 150,000+ private-markets entities.
The LP Decision Process
LPs are using data to make faster, more informed decisions. A typical LP review process now involves:
- Screening. The LP uses Altss to screen for GPs with a specific track record (e.g., top-quartile IRRs in healthcare PE, vintage years 2018–2020).
- Benchmarking. The LP compares the GP’s performance to peers, using Altss’s quartile rankings and peer-group analysis.
- Due diligence. The LP uses Altss to verify the GP’s claims, including portfolio company performance, team stability, and fund terms.
- Monitoring. After commitment, the LP uses Altss to monitor the fund’s performance, including quarterly updates and risk alerts.
The Fund Manager Opportunity
For fund managers, the data revolution is both a challenge and an opportunity. The challenge: LPs have more information than ever, and they are less willing to rely on relationships alone. The opportunity: GPs who can present a compelling, data-backed narrative will stand out.
The key is to use data to tell a story. Not “we have a great team,” but “our team has a 15-year track record of investing in healthcare services, with a 2.3x gross MOIC and a 0.8x DPI on our 2018 vintage.” Not “we source proprietary deals,” but “our sourcing platform has generated 500 proprietary deals in the past three years, with a 20% close rate.”
Altss edge: Use Altss to build a data room that LPs can access during due diligence. Include fund performance data, portfolio company metrics, and team track records. Use Altss’s benchmarking tools to show how your fund compares to peers. The goal is to make the LP’s decision easy: the data speaks for itself.
7) Emerging GPs: The Playbook for 2026
For emerging GPs raising their first or second fund, 2026 is a challenging but opportunity-rich environment. The market is selective, but LPs are actively looking for new managers with differentiated strategies. The key is to be specific, data-driven, and persistent.
The Fundraising Timeline
The average time to close a first-time fund in 2025 was 18 months, up from 12 months in 2021. The reasons are straightforward: LPs are doing more due diligence, and they are allocating to fewer managers. But the timeline varies by strategy. First-time funds in niche sectors (e.g., healthcare services, asset-based lending) close faster than those in broad sectors (e.g., generalist PE).
The LP Targeting Strategy
Emerging GPs should target LPs who have a track record of backing first-time funds. According to Altss data, 22% of LPs have allocated to a first-time fund in the past five years. These LPs include:
- Family offices. Family offices account for 35% of first-time fund commitments. They are more willing to take risks and have shorter decision-making processes.
- Endowments and foundations. These LPs account for 25% of first-time fund commitments. They are looking for high-alpha strategies and are willing to wait for returns.
- Fund-of-funds. These LPs account for 20% of first-time fund commitments. They have the expertise to evaluate emerging managers and the scale to make meaningful commitments.
The Narrative Framework
The most effective fundraising narratives for emerging GPs follow a specific structure:
- The thesis. What is the specific opportunity you are targeting? Be narrow: not “healthcare,” but “dental practice consolidation in the Southeast.”
- The edge. Why are you uniquely positioned to execute? Be specific: not “we have experience,” but “we have closed 20 dental practice acquisitions in the past three years.”
- The track record. What have you done that is relevant? Be data-driven: not “we generated good returns,” but “our team invested $150 million in dental practices, generating a 2.1x MOIC and a 1.3x DPI.”
- The ask. How much are you raising, and what will you do with it? Be clear: not “we are raising a fund,” but “we are raising a $200 million fund to acquire 50 dental practices over the next three years.”
Altss edge: Use Altss to identify LPs who match your strategy and have a track record of backing first-time funds. Use the platform’s signal filters to identify LPs who have recently hired new team members or attended industry events. The goal is to build a targeted list of 50–100 LPs and then engage them systematically.
8) The Role of Family Offices: The 9,000+ Opportunity
Family offices are the fastest-growing segment of the LP base, with 9,000+ globally tracked by Altss. They control an estimated $6 trillion in assets, and their allocations to private markets are increasing. In 2025, family offices allocated an average of 28% of their portfolios to private markets, up from 22% in 2020, according to UBS.
Why Family Offices Are Different
Family offices differ from institutional LPs in several ways:
- Decision-making speed. Family offices can make decisions in weeks, not months. They don’t have investment committees or consultant gatekeepers.
- Risk tolerance. Family offices are more willing to take risks, including backing first-time funds, investing in niche sectors, and making co-investments.
- Relationship focus. Family offices value relationships over data. They are more likely to invest with managers they know and trust.
- Direct investing. 42% of family offices make direct investments, according to Campden Wealth. They are looking for co-investment opportunities alongside fund managers.
The Family Office Engagement Strategy
Engaging family offices requires a different approach than institutional LPs. The key principles:
- Be personal. Family offices want to know who you are, not just what your fund does. Share your background, your values, and your vision.
- Be specific. Family offices are bombarded with fundraising requests. Stand out by being specific about your strategy and your edge.
- Be patient. Family offices take time to build relationships. Don’t expect a commitment after one meeting. Plan for a 6–12 month engagement cycle.
- Offer co-investment. Many family offices want to co-invest alongside fund managers. Offer them a sidecar or a direct investment opportunity.
Altss edge: Use Altss to identify family offices that match your strategy and have a track record of backing first-time funds. Use the platform’s signal filters to identify family offices that have recently made direct investments in your sector. The goal is to build a targeted list of 20–30 family offices and then engage them personally.
9) The Secondaries Opportunity: A Deep Dive
Secondaries are no longer a niche—they are a core allocation. The market is growing at 20%+ annually, and the opportunity set is expanding. But the market is also becoming more competitive, and the easy returns are gone. The winners will be those who can source proprietary deals, structure complex transactions, and offer LPs a clear value proposition.
The Market Structure
The secondaries market is bifurcated into two segments:
- LP-led secondaries. These are transactions where an LP sells its interest in a fund to a buyer. They account for 62% of volume. The average discount on LP-led transactions in 2025 was 12%, down from 18% in 2023, as competition for deals intensified.
- GP-led secondaries. These are transactions where the GP initiates a restructuring of a fund. They account for 38% of volume. The average discount on GP-led transactions was 7%, but discounts vary widely by asset quality.
The Opportunity in GP-Led Deals
GP-led secondaries are the fastest-growing segment of the market. They offer several advantages:
- Control. The GP can choose which assets to include in the continuation vehicle, allowing them to hold onto high-performing assets.
- Alignment. The GP can roll its own capital into the continuation vehicle, aligning its interests with LPs.
- Liquidity. LPs who want to exit can do so at NAV or at a discount, while LPs who want to stay can roll into the new vehicle.
But GP-led deals are also more complex. They require careful structuring, including valuation, terms, and governance. The SEC has increased scrutiny of GP-led deals, particularly around conflicts of interest.
The Emerging Manager Opportunity
For emerging managers, secondaries offer a way to build a track record. A growing number of emerging managers are raising dedicated secondaries funds, targeting the $200 billion in unrealized PE assets that are sitting in funds past their original term.
In April 2026, a team of former Hamilton Lane professionals raised a $450 million secondaries fund focused on GP-led transactions in the lower middle market. The fund was oversubscribed, with commitments from six family offices and two endowments. The pitch: smaller GP-led deals (under $100 million) are less competitive and offer higher discounts.
Altss edge: Use Altss to identify LPs who have allocated to secondaries in the past 12 months, then segment by type (pension, endowment, family office). For emerging GPs raising a secondaries fund, target LPs who have a track record of backing first-time funds in this space. The narrative should emphasize the structural tailwinds: 40% of PE funds are past their original term, and LPs need solutions.
10) The AI and Data Center Investment Thesis: A Deep Dive
The AI and data center investment thesis is one of the most compelling in private markets today. The demand for data center capacity is growing at 20%+ annually, driven by AI workloads, cloud computing, and digital transformation. But the supply side is constrained by power availability, construction costs, and permitting timelines.
The Power Problem
The single biggest constraint on data center growth is power. In the U.S., data centers are expected to consume 150 TWh of electricity by 2027, up from 80 TWh in 2023. But the grid is not keeping up. Interconnection queues are growing, and capacity prices are spiking.
The solution is a combination of:
- Renewable energy. Solar and wind are the cheapest sources of new generation, but they are intermittent. Data centers need 24/7 power.
- Natural gas. Gas-fired generation is the most reliable backup, but it has carbon emissions.
- Nuclear. Small modular reactors (SMRs) are a promising technology, but they are years away from commercial deployment.
- Battery storage. Batteries can smooth out the intermittency of renewables, but they are expensive at utility scale.
The Investment Opportunity
The investment opportunity in AI and data centers spans multiple asset classes:
- Data center REITs. The sector is consolidating, and the largest players (Digital Realty, Equinix, CyrusOne) are trading at premiums to NAV. But smaller data center developers are available at lower valuations.
- Power generation. The need for new power generation is creating opportunities in natural gas, nuclear, and renewable energy. The returns are attractive, but the timelines are long.
- Grid infrastructure. The grid itself needs to be upgraded. This includes transmission lines, substations, and distribution systems. The market is estimated at $100 billion annually in the U.S. alone.
- Cooling technology. Data centers generate enormous amounts of heat. Liquid cooling is emerging as a more efficient solution than traditional air cooling. The market is small but growing at 30%+ annually.
The GP Opportunity
For GPs, the AI and data center thesis offers a clear narrative. The demand is visible, the supply is constrained, and the returns are attractive. But the thesis requires specific expertise: power markets, construction management, and technology.
GPs with a track record in energy infrastructure or real estate are best positioned. The key is to be specific about the opportunity: not “we invest in AI,” but “we invest in data center power solutions in the Mid-Atlantic, where PJM capacity prices are up 400% year-over-year.”
Altss edge: Use Altss to identify LPs with dedicated infrastructure allocations exceeding $500 million and a track record in energy or power. Use the platform’s signal filters to identify those who have recently hired energy specialists or attended industry conferences. Pair them with GPs who have a clear thesis on grid-edge infrastructure or data center power solutions.
11) The Private Credit Structuring Advantage: A Deep Dive
Private credit is the largest asset class in private markets, but the easy returns are gone. The winners going forward will be those who can structure deals that offer downside protection, not just yield.
The Structuring Toolkit
The most effective structuring techniques include:
- Covenants. Financial maintenance covenants (minimum EBITDA, maximum leverage) give lenders the ability to intervene early if a borrower’s financial health deteriorates. In 2026, 35% of direct lending deals include meaningful covenants, up from 15% in 2024.
- Collateral. Asset-based lending, where loans are secured against hard assets, offers lower default rates and higher recovery rates. ABL now accounts for 22% of private credit origination.
- Seniority. Bifurcated structures, where the loan is split into senior and junior tranches, allow LPs to choose their risk/return profile. The senior tranche offers lower yields but higher safety; the junior tranche offers higher yields but more risk.
- Equity cushions. Requiring borrowers to maintain a minimum equity cushion (e.g., 30% of the capital structure) reduces the risk of default.
The Sectoral Focus
The sectors with the best structuring opportunities are:
- Healthcare services. Dental practices, veterinary clinics, and outpatient surgery centers have recurring revenue and high barriers to entry. They are ideal for covenant-lite structures with moderate leverage.
- Industrial distribution. Companies that distribute essential parts and equipment have stable cash flows and low correlation to the economic cycle. They are ideal for asset-based lending structures.
- Software. Software companies have high margins and low capital intensity, but they also have high churn rates. They require careful underwriting of recurring revenue and customer concentration.
The LP Due Diligence Shift
LPs are getting more sophisticated in their private credit due diligence. In 2026, 72% of LPs require GPs to provide granular portfolio data, including loan-level performance, covenant compliance, and recovery rates. The Altss platform supports this shift by providing continuously refreshed data on private credit fund performance.
Altss edge: Use Altss to benchmark your private credit fund against peers, including IRR quartile rankings, distribution yields, and default rates. Use the platform’s signal filters to identify LPs who are actively allocating to private credit and have a track record of backing first-time funds.
12) The PE Deal Dynamics Shift: A Deep Dive
Private equity deal activity is recovering, but the pattern is different from previous cycles. The key shifts are:
The Add-On Dominance
Add-on acquisitions accounted for 68% of all PE deals in 2025, up from 55% in 2020. The logic is straightforward: buying a platform company and then adding smaller tuck-ins is less risky than a standalone buyout. The Altss platform tracks add-on activity at the fund level, allowing LPs to see which GPs are creating value through consolidation vs. organic growth.
The Minority Investment Trend
Minority investments accounted for 22% of PE deal value in 2025, up from 15% in 2020. The trend is being driven by family-owned businesses that want growth capital but not a full exit, and by technology companies that want strategic partners.
The Cross-Border Recovery
Cross-border PE deal value reached $320 billion in 2025, up from $250 billion in 2024. The recovery is concentrated in two corridors: U.S. to Europe (where valuations are lower) and U.S. to Asia (where growth is higher).
The Sectoral Rotation
The sectors attracting the most PE interest in 2026 are healthcare services (22% of deal value), technology (28%), and industrials (18%). The key is to be specific about the sub-sector: not “healthcare,” but “dental practice consolidation.”
Altss edge: Use Altss to identify LPs who are actively deploying capital in PE, then segment by sector preference. For GPs with a healthcare focus, target LPs
Find the allocators who actually back funds like yours
GPs and IR teams use Altss to research allocators with ownership, commitment, transaction and relationship context, then prioritize outreach.


See the allocators behind your next close.
Public records carry source-specific dates where available. No population-wide measured refresh cadence or universal verification deadline is established here. Page modified, source captured, fact observed, entity verified and aggregate measured describe different events. Check the date attached to the relevant claim; a missing verification date means unknown. Stored source history does not establish a customer-facing historical-analysis interface.