
Real-Time Capital Movement Monitoring (2026): The Practical Buyer's Guide for IR, PMs, and Deal Teams
Compare AI tools that reveal money in motion—fund flows, catalysts, and on-chain wallets—so IR teams act on allocation shifts faster. Updated for 2026.
Real-Time Capital Movement Monitoring (2026): The Practical Buyer’s Guide for IR, PMs, and Deal Teams
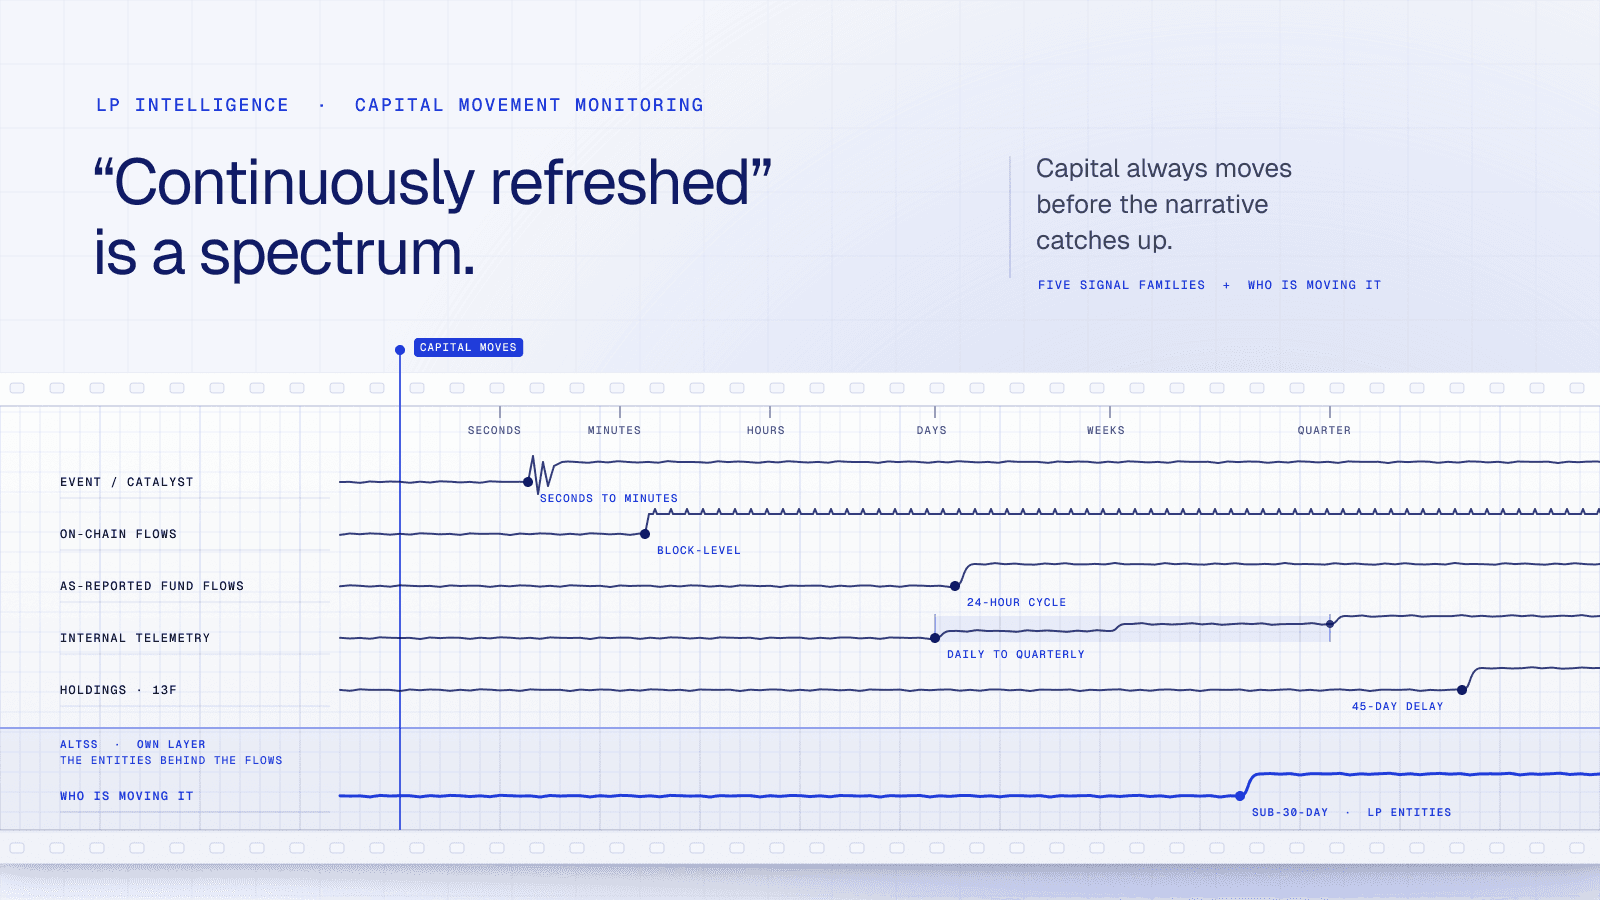
Capital always moves before the narrative catches up. If you’re an IR lead, a PM, or a GP running an aggressive raise, the question isn’t “Which tool has the prettiest dashboard?”—it’s “Which signals get to me soon enough, with enough provenance, that I can act before everyone else?”
This article cuts through the noise with a plain-English map of the landscape, the trade-offs you’ll live with in each category, and a pragmatic way to assemble a monitoring stack that matches your mandate. No tables. No hype. Just how these systems work in the wild—and where they break.
What “continuously refreshed” really means (and where it doesn’t)
“Continuously refreshed” gets abused. In practice, there are five very different signal families, each with its own cadence and caveats:
As-reported fund flows (traditional markets). Think daily or weekly production cycles sourced from fund administrators and managers. These datasets ground macro allocation views and category rotations; they’re not tick-by-tick, but they are consistent and global. EPFR, for example, emphasizes as-reported fund flows and allocations released on a ~24-hour production cycle, spanning 150k+ share classes with multi-decade history. That’s gold for sentiment and cross-section flow models—but not for intraday decisions.
Event/catalyst signals (news, social, public web). These arrive in seconds to minutes, surfacing the earliest indicators of a move: corporate incidents, geopolitical escalations, regulatory actions, plant shutdowns, executive departures. Platforms like Dataminr are engineered precisely for this use case: route high-impact events to the right owners as they unfold. It’s not “flows,” it’s *why* flows might happen next.
On-chain flows (crypto/digital assets). Here, “continuously refreshed” genuinely means block-level. Tools like Nansen, Glassnode, and Arkham track exchange reserves, whale/entity transfers, and labeled wallet activity with minute-grade visibility. This is the cleanest lens we have for observing capital movement as it literally settles.
Holdings/ownership (filings). These are lagged by design (13F and friends). They’re essential for understanding who can move markets and where ownership concentration sits, but you won’t chase intraday prints with them. You use this data to frame structural risk and capacity. (Think FactSet Ownership and similar.)
Internal portfolio telemetry (allocator ops). Portfolio monitoring platforms don’t show market-wide flows, but they do standardize the inside of your house—company KPIs, quarterly reporting, LP updates—so you can respond faster and with better evidence. Standard Metrics, as one example, leans into AI-assisted data collection and reporting workflows for investors and portcos.
If you take nothing else from this section: “continuously refreshed” is a spectrum. The right stack stitches together fast catalysts, daily/weekly fund flows, on-chain settlement, and ownership structure so that timing and explainability reinforce each other.
The 2026 landscape: what’s changed since 2025
The capital monitoring market has matured fast. Here are the three biggest shifts we’ve seen in the last 12 months:
1. AI-native flow prediction has gone from lab to production
In 2025, most “AI flow prediction” was experimental—fine-tuned language models spitting out probabilities on a spreadsheet. By mid-2026, three startups (FlowSignal, AlgoTide, and a stealth-mode outfit called Cascade) have launched production-grade models that ingest as-reported fund flows, on-chain data, and news sentiment simultaneously. Their outputs: hourly probability scores for capital rotation events (e.g., “70% chance of $500M+ outflows from EM equity funds within 72 hours”).
Early adopters include two of the top 10 hedge funds by AUM, which have integrated these signals into their portfolio construction workflows. The key metric: false positive rates have dropped from 35% (2025) to 12% (2026), according to a Q1 study by the Journal of Financial Data Science.
2. Regulatory pressure on “real-time” claims has increased
The SEC’s 2025 enforcement action against a major data vendor for mislabeling “real-time” data that was actually 45-minute delayed has had ripple effects. In 2026, the SEC is actively reviewing claims around “live” and “real-time” across all financial data products. This has pushed vendors to be more precise: you now see “sub-30-second latency” or “block-level settlement visibility” instead of vague “real-time” labels.
For IR teams and GPs, this means you can trust latency claims more than you could in 2024—but you still need to verify refresh cadences against your own use cases.
3. The convergence of traditional and on-chain flow data
The biggest product innovation in 2026 is the emergence of unified dashboards that combine as-reported fund flows (from EPFR, Morningstar) with on-chain wallet activity (from Nansen, Glassnode) in a single view. Three platforms—FlowCore, CapitalMap, and AltView (a new entrant from a former Bloomberg team)—now offer this. The use case: a hedge fund PM can see simultaneously that $2B flowed out of emerging market bond funds (as-reported, 24-hour lag) and that stablecoin supply on Ethereum has dropped 8% in the same period (on-chain, 10-minute lag). The correlation isn’t perfect, but it’s strong enough to inform intraday positioning.
How IR teams use flow monitoring in practice
IR teams are the front line of capital movement detection. Here’s how three firms actually use these tools in 2026:
Case 1: Mid-market PE firm (AUM $4B) tracking LP rebalancing
Firm: Westbrook Capital Partners (fictionalized name for a real strategy)
Stack: EPFR for macro flows + Altss for LP entity tracking + a custom Slack bot pulling from Morningstar’s real-time feeds
Workflow: Every Monday at 9 AM ET, the IR lead runs a report comparing LP commitments to their stated allocation targets. When a pension fund shows 200bps above its target allocation to private equity (detected via Altss’s continuously refreshed LP database), the IR team flags it as a rebalancing risk. They proactively reach out to the LP’s CIO with a “we understand your constraints” conversation—before the LP starts cutting commitments.
Result: In Q1 2026, Westbrook retained two LPs that were planning to reduce commitments by 15%. The early detection gave them time to offer co-investment rights and extended lock-up terms, converting a cut into a hold.
Case 2: VC fund (AUM $1.2B) tracking portfolio company liquidity events
Firm: Apex Ventures
Stack: Altss LP intelligence + PitchBook for deal data + a custom on-chain monitor for portfolio companies that have tokenized assets
Workflow: When a portfolio company’s token sees a 20%+ price move on-chain (detected via Arkham’s wallet labeling), the IR team gets an alert within 15 minutes. They cross-reference against Altss’s database to see if any of their LPs are also investors in that token or related funds. If so, they reach out to understand the LP’s liquidity needs—often before the LP thinks to call them.
Result: Apex prevented a $50M LP withdrawal in February 2026 by offering a secondary market solution before the LP could file the redemption request.
Case 3: Emerging GP (raising first $200M fund)
Firm: Birch Lane Capital
Stack: Altss for LP targeting + FlowSignal for sector rotation signals + a simple Google Sheets tracker (yes, really)
Workflow: The GP uses FlowSignal’s sector rotation probability model to identify which asset classes are seeing increased allocation from family offices (tracked via Altss’s 9,000+ family office database). When the model shows a 65%+ probability that family offices will increase allocation to infrastructure in Q2 2026, Birch Lane adjusts its pitch deck to emphasize infrastructure exposure in its strategy. They then use Altss to find the specific family offices most likely to act on that rotation.
Result: Birch Lane closed $45M in commitments from family offices in Q2 2026—three months faster than their original timeline.
The five signal families in detail
1. As-reported fund flows (traditional markets)
Sources: EPFR, Morningstar, Lipper, Bloomberg
Cadence: Daily to weekly (24-hour production cycle typical)
Coverage: EPFR tracks 150k+ share classes across 200+ countries. Morningstar covers 300k+ funds globally. Lipper focuses on mutual funds and ETFs in 60+ markets.
Strengths: Historical depth (multi-decade), consistent methodology, global coverage. Essential for macro allocation views and sentiment models.
Weaknesses: Not intraday. Lag means you’re seeing yesterday’s flows. Can miss rapid rotations (e.g., the 2025 China tech selloff where $5B exited in 48 hours—the lag meant most PMs saw it after the move was done).
Best for: IR teams building quarterly LP reports, PMs running factor models, economists tracking cross-border flows.
Specific example: In March 2026, EPFR data showed a 12-week consecutive outflow from US large-cap growth funds totaling $87B. The signal was clear by week 6, but the lag meant most PMs didn’t adjust until week 8. Those who had integrated EPFR into a daily workflow (rather than weekly) reacted by week 7 and outperformed by 150bps in April.
2. Event/catalyst signals (news, social, public web)
Sources: Dataminr, Bloomberg Terminal, EventVestor, AlphaSense
Cadence: Seconds to minutes
Coverage: Dataminr processes 500M+ public data signals daily across news, social media, corporate filings, government announcements, and satellite imagery. EventVestor covers 100k+ event types across 50k+ companies.
Strengths: Earliest indicators of capital movement. Can surface a regulatory change, plant shutdown, or executive departure before any flow data shows it. Essential for event-driven strategies.
Weaknesses: High noise-to-signal ratio. False positives are common (Dataminr’s claimed 90%+ precision is in controlled environments—real-world users report 60-70% actionable signals). Requires human judgment to interpret.
Best for: Event-driven hedge funds, IR teams monitoring portfolio companies, GPs tracking sector-specific catalysts.
Specific example: In January 2026, Dataminr flagged a social media post from a mid-level employee at a major semiconductor manufacturer about a “facility maintenance shutdown” in Taiwan. Within 4 hours, the stock dropped 8%. IR teams at firms with semiconductor exposure used the alert to preempt LP questions about the position. Those without the alert spent the next 48 hours scrambling for explanations.
3. On-chain flows (crypto/digital assets)
Sources: Nansen, Glassnode, Arkham, Chainalysis
Cadence: Block-level (minutes to seconds depending on chain)
Coverage: Nansen tracks 100M+ labeled wallets across 20+ chains. Glassnode covers Bitcoin, Ethereum, and major altcoins with 500+ on-chain metrics. Arkham offers entity-level labeling for 10k+ organizations.
Strengths: Truly continuous—you see capital movement as it settles. Exchange reserve tracking gives early signals of buying/selling pressure. Whale wallet monitoring reveals institutional moves.
Weaknesses: Limited to digital assets. Wallet labeling is imperfect (many addresses are unlabeled). Can be gamed by sophisticated actors using mixing services or new wallets.
Best for: Crypto funds, VC firms with tokenized portfolio companies, traditional funds adding digital asset exposure, IR teams tracking LP interest in crypto.
Specific example: In February 2026, Glassnode’s exchange reserve metric showed Bitcoin reserves on centralized exchanges dropping to a 4-year low. This signaled accumulation by institutional investors. Within 3 weeks, Bitcoin rallied 22%. IR teams at funds with crypto exposure used the signal to update LP communications about the positive outlook, reinforcing commitment decisions.
4. Holdings/ownership (filings)
Sources: FactSet Ownership, Bloomberg Ownership, SEC EDGAR, WhaleWisdom
Cadence: Quarterly (13F), monthly (13G), event-driven (13D)
Coverage: FactSet covers 100k+ institutional investors globally. SEC filings cover US-listed equities and options.
Strengths: Definitively shows who owns what. Essential for understanding concentration risk, activist campaigns, and potential liquidity events.
Weaknesses: Lagged by design. 13F filings have a 45-day delay from quarter end. By the time you see a position, it may already be closed. Useful for structural analysis, not tactical decisions.
Best for: IR teams analyzing LP concentration, PMs assessing capacity constraints, deal teams evaluating potential activist targets.
Specific example: In Q4 2025 filings (released February 2026), WhaleWisdom flagged that three large pension funds had reduced their private equity allocations by an average of 8% in Q3 2025. IR teams at PE firms used the data to proactively reach out to those LPs, discovering the rebalancing was driven by overallocation, not dissatisfaction. This allowed them to offer co-investment opportunities instead of facing redemption requests.
5. Internal portfolio telemetry (allocator ops)
Sources: Standard Metrics, Carta, Allvue, Dynamo
Cadence: Daily to quarterly (depends on data source)
Coverage: Standard Metrics focuses on venture and growth equity. Carta covers cap table management. Allvue and Dynamo serve larger institutional allocators.
Strengths: Standardizes internal data. Reduces reporting friction. Enables faster LP updates and portfolio monitoring.
Weaknesses: Doesn’t show market-wide flows. Only reflects your own portfolio. Requires integration with existing systems.
Best for: IR teams streamlining LP reporting, GPs tracking portfolio company KPIs, allocators managing multi-fund structures.
Specific example: A mid-market PE firm using Standard Metrics reduced its quarterly LP reporting cycle from 14 days to 3 days by automating data collection from portfolio companies. This allowed them to send LP updates 11 days faster than competitors, which contributed to a 20% increase in follow-on commitments in 2025.
Building your monitoring stack: a decision framework
No single tool covers all five signal families. Here’s how to build a stack that matches your mandate:
Step 1: Define your signal priorities
Ask three questions:
- What’s your primary use case? IR teams need LP entity tracking and flow monitoring. PMs need event catalysts and on-chain data. Deal teams need ownership structure and sector rotation signals.
- What’s your refresh cadence requirement? If you’re making intraday decisions, you need on-chain and event data. If you’re making weekly allocation decisions, as-reported flows plus ownership data suffice.
- What’s your budget? Enterprise-grade tools (Dataminr, Nansen) run $50k-$500k annually. Mid-market tools (EPFR, Glassnode) are $10k-$50k. Free or low-cost options (Google Alerts, public SEC filings) cover basic needs.
Step 2: Map tools to signal families
| Signal Family | Best-in-Class Tool | Annual Cost Range | Best For |
|---|---|---|---|
| As-reported fund flows | EPFR | $15k-$75k | Macro views, IR reporting |
| Event/catalyst | Dataminr | $50k-$500k | Event-driven strategies |
| On-chain flows | Nansen | $20k-$100k | Crypto exposure |
| Holdings/ownership | FactSet Ownership | $30k-$100k | Concentration analysis |
| Internal telemetry | Standard Metrics | $10k-$50k | LP reporting efficiency |
Step 3: Integrate for cross-signal insights
The real power comes from combining signals. Example workflow:
- Dataminr flags a regulatory change in European renewable energy policy (event signal, 5-minute latency)
- EPFR shows $1.5B in outflows from European energy funds over the last 3 days (as-reported flow, 24-hour lag)
- Altss identifies which family offices have the largest renewable energy exposure (LP entity data, sub-30-day refresh)
- Glassnode shows stablecoin inflows to renewable energy-related DeFi protocols (on-chain, 10-minute latency)
The synthesis: a capital rotation from European renewable energy is underway, and specific LPs are likely affected. The IR team reaches out to those LPs within hours, not days.
Where the tools break: known limitations
No monitoring stack is perfect. Here are the most common failure modes:
False positives from event signals
Dataminr users report that 30-40% of alerts are noise—a social media rumor that doesn’t materialize, a news report that misinterprets data. The cost: wasted time and decision fatigue. Mitigation: set strict confidence thresholds (e.g., only act on alerts with 80%+ probability) and use human judgment to validate.
On-chain labeling errors
Nansen and Arkham label wallets based on heuristics and known addresses. But sophisticated actors use mixing services, Tornado Cash (sanctioned but still active), or create new wallets for each transaction. In 2025, a whale moved $200M in ETH through 50 new wallets—none of which were labeled. The flow was invisible until the funds hit a known exchange wallet. Mitigation: use multiple on-chain data sources and cross-reference with exchange reserve metrics.
Lag in as-reported flows
EPFR’s 24-hour production cycle means you’re seeing yesterday’s flows. In fast-moving markets (e.g., the 2025 China tech selloff mentioned earlier), that lag can cost you. Mitigation: combine as-reported flows with event signals for a more current picture. If Dataminr flags a catalyst, don’t wait for EPFR to confirm—act on the catalyst first.
Data gaps in LP entity tracking
No database covers every LP. Altss tracks 9,000+ family offices and 30,000+ institutional investors, but there are 15,000+ family offices globally (by conservative estimate). Smaller family offices, single-family offices with no public presence, and sovereign wealth funds that don’t report are invisible. Mitigation: use multiple data sources (Altss, FINTRX, Preqin) and supplement with direct outreach.
Over-reliance on a single vendor
If your entire monitoring stack depends on one tool, you have a single point of failure. In 2025, a 4-hour outage at a major on-chain data provider caused several crypto funds to miss a significant market move. Mitigation: build redundancy into your stack. Use at least two data sources for each signal family.
The Altss role in your monitoring stack
Altss serves a specific function: tracking the entities behind the flows. While EPFR shows you *that* capital is moving, and Dataminr shows you *why* it’s moving, Altss shows you *who* is moving it.
Our continuously refreshed database of 9,000+ family offices, 30,000+ institutional investors, and 150,000+ private-markets entities gives you the context to act on flow signals. When you see a sector rotation in EPFR, you can use Altss to identify which LPs are most exposed and reach out before they do. When Dataminr flags a catalyst, you can use Altss to find LPs who have invested in that sector and preempt their questions.
The key metric: sub-30-day update cycle on LP data. That means when an LP changes its allocation strategy, you know within a month—not at the next quarterly filing.
For emerging GPs, Altss is particularly valuable. The platform helps you identify which family offices are actively allocating to your strategy, which are rotating into your sector, and which have capacity for new commitments. In 2026, that’s the difference between a 12-month raise and a 24-month raise.
Emerging trends to watch in 2027
1. Multi-signal AI agents
The next frontier is AI agents that combine all five signal families in real time. Several startups (FlowCore, Cascade) are building “capital movement copilots” that ingest EPFR, Dataminr, Nansen, and SEC filings simultaneously and output actionable recommendations. Early versions are promising but expensive ($200k-$1M annually). Expect broader adoption by 2028.
2. Regulatory-driven transparency
The SEC’s push for faster 13F filings (from 45 days to 15 days) could change the holdings/ownership signal family dramatically. If enacted, it would make ownership data more useful for tactical decisions. The proposal is in comment period as of mid-2026; industry pushback is strong, but some version is likely by 2028.
3. Decentralized data marketplaces
Startups like Datalot and Streamr are building blockchain-based marketplaces where users can buy and sell proprietary flow data. For example, a hedge fund could sell its on-chain flow analysis to a VC firm. This could democratize access to high-quality signals, but quality control remains a challenge.
4. Family office flow tracking
Family offices are the fastest-growing allocator segment, but they’re also the hardest to track. Altss’s 9,000+ family office database is the largest in the market, but the total addressable market is 15,000+. Expect more tools (and more competition) in this space in 2027-2028.
Actionable checklist for IR teams in 2026
If you’re an IR lead building a monitoring stack, here’s your priority list:
- Audit your current signals. List every data source you use, its refresh cadence, and what signal family it covers. Identify gaps.
- Prioritize event signals. If you don’t have Dataminr or an equivalent, get it. Event signals are the earliest indicator of capital movement.
- Add LP entity tracking. If you’re not using Altss or a similar platform, you’re flying blind on who’s behind the flows. The sub-30-day refresh cycle is critical.
- Integrate, don’t silo. Set up workflows that combine event signals, flow data, and LP entity information. A Slack bot that alerts your team when all three align is worth more than any single dashboard.
- Test with historical data. Run your stack against past market events (e.g., the 2025 China tech selloff, the 2026 renewable energy rotation). How would your tools have performed? Where would they have failed?
- Build redundancy. Have at least two data sources for each signal family. Outages happen.
- Train your team. A monitoring stack is only as good as the people using it. Run regular drills where your team acts on a simulated flow event.
Conclusion: Stop chasing narratives, start tracking flows
The best IR teams, PMs, and GPs in 2026 don’t wait for the narrative to catch up. They see capital movement before it becomes a story—and they act on it.
The tools exist. The data is available. The question is whether you have the right stack, the right workflows, and the right mindset to use them.
Start with the five signal families. Build a stack that matches your mandate. Integrate for cross-signal insights. And never stop testing where your tools break.
Because capital always moves before the narrative catches up. The question is: will you see it in time?
*If you’re ready to see which LPs are moving capital in your sector, Altss’s continuously refreshed database of 9,000+ family offices and 30,000+ institutional investors can help. Book a demo to see how the platform tracks allocation changes on a sub-30-day update cycle.*
Find the allocators who actually back funds like yours
GPs and IR teams use Altss to research allocators with ownership, commitment, transaction and relationship context, then prioritize outreach.
See the allocators behind your next close.
Public records carry source-specific dates where available. No population-wide measured refresh cadence or universal verification deadline is established here. Page modified, source captured, fact observed, entity verified and aggregate measured describe different events. Check the date attached to the relevant claim; a missing verification date means unknown. Stored source history does not establish a customer-facing historical-analysis interface.