
Single-Family Office Allocation Playbook 2026
How single-family offices should allocate in 2025: theme-first core, Japan rotation, selective REITs, data-center power realities, Asia HY/frontier.
Single-Family Office Allocation Playbook 2026
Three dynamics are forcing CIOs to rewire their playbooks: rates diverge across G3 economies, AI capex confronts physical grid ceilings, and liquidity windows compress faster than vintage models predict.
Why 2026 Is Different
Rate Divergence Creates Tactical Windows
The Federal Reserve cut twice in late 2025—50bp total—but paused in Q1 2026 as core PCE held at 2.8%. Markets now price two more cuts in H2 2026. The Bank of Japan, meanwhile, hiked to 0.75% in December 2025 and signaled another 25bp move by June 2026. The ECB cut 75bp since September 2025 and sits at 2.25%, with Lagarde signaling neutral by year-end.
This three-way divergence means carry trades, duration bets, and FX hedges no longer move in lockstep. A family office that bought 10-year JGBs for yield pickup in 2025 now faces negative real returns if the yen strengthens 5% against USD. A U.S. office that hedged EUR exposure via forwards at 1.05 now watches the cross trade at 1.12.
The tactical window for FX overlays is now 45-60 days, not quarters. Altss tracks 9,000+ family offices globally and shows that 34% of single-family offices (SFOs) with >$500M AUM now run active FX hedging programs—up from 18% in 2023.
AI Capex Is a Super-Cycle with a Ceiling
Big Tech spent $218B on capex in 2025, per company filings. Microsoft alone allocated $68B, with $44B going to compute infrastructure. Google spent $52B, Amazon $48B. The 2026 consensus calls for $280B-$320B across the Magnificent Seven.
But grid constraints are the binding variable. The U.S. has 2,200 GW of interconnection requests queued—95% for solar, wind, and battery storage—but the average project waits 4.7 years for approval (Lawrence Berkeley National Lab, 2025). Data center developers need 50-100 MW per facility and face 3-5 year lead times for new transmission.
The ceiling is cost of capital. A 500 MW data center costs $4B-$6B to build. At 7.5% WACC, the annual interest burden is $300M-$450M. At 9% WACC—where many project finance deals now price—that jumps to $360M-$540M. Margins compress unless tenants pre-commit to 10-15 year leases at $80-$120/MWh.
Expect high dispersion by region. Northern Virginia has 3.2 GW of data center capacity and 8 GW in pipeline—but Dominion Energy warns it may not connect new loads until 2028. Meanwhile, Ohio, Indiana, and Texas have faster permitting and lower power costs ($35-$50/MWh vs. $60-$80/MWh in NoVA).
Liquidity Windows Are Shorter
H1 2025 saw a surge in U.S. startup funding—$79B across 8,200 deals, per PitchBook—led by AI (42% of dollars). But VC fundraising stayed tight: 202 funds closed $41B, down 22% from 2024. The median time to close a new fund stretched to 18 months.
Good exits clear quickly. CoreWeave's $1.5B secondary in Q2 2025 closed in 8 weeks. Anthropic's $2B Series E in Q3 2025 took 11 weeks. But new funds grind: 60% of 2026 vintage funds in market as of February have been fundraising for 14+ months.
For family offices, this means the window to deploy co-investment capital is 30-45 days post-term sheet, not 90. Altss data shows that 28% of SFOs now maintain a "dry powder pool" of 10-15% of AUM in cash equivalents, deployable within 14 days.
1) Theme-First Core (Ditch Static 60/40)
Why Themes Now
Long-horizon drivers—policy, demographics, and general-purpose tech (AI)—are doing more work than classic factor timing. The 60/40 portfolio returned 8.2% annualized over 2020-2025, but with 14.7% volatility. A theme-rotated portfolio targeting AI, energy transition, and healthcare innovation returned 11.3% with 12.1% volatility over the same period (MSCI Thematic Index family, 2026).
Use themes to express secular views, not to chase headlines. MSCI's Thematic Exposure Framework identifies 48 themes across 6 macro clusters. Their 2025 research shows that single-theme equity sleeves can be 0.6-0.8 correlated with broad beta unless sized and blended deliberately.
Beware Thematic ETF Wrappers
Thematic ETFs boomed—$245B AUM globally as of January 2026, up from $180B in 2024. But performance dispersion is brutal. The ARK Innovation ETF (ARKK) returned -12.4% in 2025 after a +68% 2023. The Global X Robotics & AI ETF (BOTZ) returned +14.2% in 2025 but with 0.89 beta to the S&P 500.
If you use them, keep allocations modest (under 5% of equity sleeve) and know the entry multiple. The average thematic ETF trades at 28x forward earnings vs. 22x for the S&P 500. At 30x+, you're paying for narrative, not cash flows.
Altss Screening Grid (Five Questions Before You Size a Theme)
- Structural driver: What policy/tech/demographic force compounds value over 10+ years? (e.g., AI's impact on labor productivity, not "AI is cool")
- Timing: Early (capacity constrained, high uncertainty), mid (crowding risk, multiple expansion), or late (multiple compression, commoditization)?
- Profit pools: Are margins expanding or being competed away? (e.g., Nvidia's 55% net margins vs. AMD's 12%—but Blackwell's 2026 ramp may compress both)
- Liquidity path: Listed proxies (e.g., Nvidia, Constellation Energy) vs. private SPVs/crossover (e.g., CoreWeave, Databricks)?
- Convergence: Where two forces compound (e.g., AI × energy systems, AI × healthcare data, AI × materials discovery)?
Nine Conviction Themes (2026-2030) and How to Underwrite Them
#### 1. Enterprise AI Rollout (Focus on Workflow-Embedded ROI)
Forget model headlines. The 2026 play is enterprise deployment: companies embedding AI into existing workflows to cut costs 15-30%. McKinsey's 2025 survey found that 72% of enterprises have deployed AI in at least one business function, up from 50% in 2024. The ROI sweet spot is customer service (30-40% cost reduction), supply chain (15-20% inventory reduction), and software development (20-30% productivity gain).
Listed proxies: Microsoft (Azure AI + Copilot), Salesforce (Einstein), ServiceNow (Now Assist). Private: Writer, Glean, Harvey (legal AI).
Underwrite: Focus on companies with >20% revenue growth from AI products and >50% gross margins. Avoid pure-play AI consultancies—margins compress as tools commoditize.
#### 2. Energy-System Upgrades (Transmission, Firm Power, Storage)
The U.S. needs to double transmission capacity by 2035 to meet AI load growth and electrification targets. That's $2.1T in investment, per the Brattle Group. But only 12% of proposed transmission projects have secured financing through 2026.
Firm power is the bottleneck. Natural gas plants are the fastest option (2-3 years to build) but face ESG constraints. Small modular reactors (SMRs) are 5-7 years out; NuScale's first commercial plant won't deliver power until 2029 at earliest. Battery storage is scaling but limited to 4-8 hours of discharge—insufficient for data center baseload.
Listed proxies: NextEra Energy (transmission + renewables), GE Vernova (gas turbines), Quanta Services (grid infrastructure). Private: Form Energy (long-duration storage), NuScale Power (SMRs).
Underwrite: Look for companies with >15% revenue growth from grid modernization and >12% EBITDA margins. Avoid merchant power producers with unhedged exposure to gas price volatility.
#### 3. Circular Economy & Materials Recovery
The global circular economy market is $410B and growing 12% annually, per Accenture. The driver: regulatory pressure (EU's Critical Raw Materials Act, U.S. Inflation Reduction Act provisions) and corporate net-zero commitments.
Key segments: Battery recycling (lithium, cobalt, nickel recovery), e-waste processing (rare earths), plastic chemical recycling.
Listed proxies: Li-Cycle (battery recycling), Republic Services (waste management), Ecolab (water treatment). Private: Redwood Materials, Cirba Solutions.
Underwrite: Focus on companies with proprietary recovery technology (>90% recovery rates) and secured offtake agreements. Avoid capital-intensive recyclers with unproven scale—many have burned through $500M+ with minimal revenue.
#### 4. Natural-Capital Monetisation (Measurement + Verified Offtake)
Carbon markets hit $1.1B in 2025, up from $728M in 2024, per Ecosystem Marketplace. But 60% of credits are still unverified or low-quality. The 2026 play is measurement technology: satellite imagery, soil sensors, and AI-driven verification that generate high-integrity credits.
Listed proxies: Planet Labs (satellite imagery), Trimble (ag tech), Verra (registry). Private: Pachama, NCX (natural capital exchange).
Underwrite: Look for companies with >50% gross margins on measurement/verification revenue and >30% revenue growth. Avoid carbon project developers with large land holdings—returns are lumpy and illiquid.
#### 5. Full-Spectrum Fixed Income (Carry with Convexity)
The 2026 fixed income play is barbelled: short-duration IG credit (1-3 year maturities, 4.5-5.5% yields) for carry, plus long-duration Treasuries (20-30 year, 4.2-4.8% yields) for convexity if rates fall. Avoid intermediate duration (5-10 year)—it's the worst of both worlds.
High yield is selective: default rates are 2.8% (Moody's, 2026) but rising in retail and healthcare. Focus on BB-rated energy and technology issuers with >3x interest coverage.
Listed proxies: iShares 1-3 Year Credit Bond ETF (IG), SPDR Bloomberg High Yield ETF (HY). Private: Direct lending funds (Ares, Golub Capital) with 8-10% target returns.
Underwrite: Use duration-matched liability modeling. For a family office with 10-year spending horizon, hold 30% in short-duration carry and 20% in long-duration convexity. Rebalance quarterly.
#### 6. Diversification Resilience (Low-Correlation Sleeves You Can Rebalance Into Shocks)
The 2026 play is assets with <0.3 correlation to equities and <0.2 correlation to bonds. Candidates: managed futures, trend-following CTAs, reinsurance-linked securities, and catastrophe bonds.
Managed futures returned +8.5% in 2025 (SG CTA Index) vs. S&P 500's +12.3%, but with 6.2% volatility. Cat bonds returned +9.1% with 3.4% volatility (Swiss Re Cat Bond Index).
Listed proxies: iMGP DBi Managed Futures ETF (DBMF), Stone Ridge Reinsurance Risk Premium Fund. Private: Aspect Capital, Winton Group (CTA funds).
Underwrite: Allocate 5-10% of portfolio to these sleeves. Rebalance into equities after a 15%+ drawdown in the S&P 500. The strategy works because CTAs and cat bonds are directional—they perform in crises when correlations spike.
#### 7. Holistic Private-Markets Programme (Vintage Pacing Over Headline Timing)
Private markets returned 9.2% in 2025 (Cambridge Associates U.S. Private Equity Index) vs. public equities' 12.3%. But dispersion is wide: top-quartile PE funds returned 18.4%, bottom-quartile returned 2.1%.
The key is vintage pacing, not timing. Commit 10-15% of AUM annually across vintages, targeting 3-5 funds per year. Avoid the temptation to skip a vintage because "valuations are high"—you miss the best entry points (2020 vintage returned 22.3% annualized; 2022 vintage returned 14.1%).
Listed proxies: Listed PE firms (KKR, Blackstone, Apollo) trade at 1.5-2.5x NAV—a liquid proxy for private markets exposure. Private: Direct co-investments in growth-stage companies (Series B-D) with $50M-$200M check sizes.
Underwrite: For direct deals, require >30% revenue growth, >60% gross margins, and a clear path to profitability within 24 months. Avoid companies with >5x net debt/EBITDA.
#### 8. SDG-Linked Impact (Outcome-Tied, Not Label-Tied)
Impact investing is $1.5T globally (GIIN, 2025), but only 18% of funds have verified outcome metrics. The 2026 play is SDG-linked bonds and loans with coupon step-downs tied to measurable KPIs (e.g., carbon reduction, water savings, gender diversity).
Listed proxies: IFC's SDG-linked bond program ($5B issued), Enel's SDG-linked bond. Private: BlueOrchard Finance, responsAbility Investments.
Underwrite: Focus on instruments with >50bp coupon step-down for achieving KPIs and independent verification (e.g., Sustainalytics, ISS ESG). Avoid "greenwashing" funds with vague impact claims—demand audited annual impact reports.
#### 9. Tail-Risk Overlays (Defined Spend; Clear Re-Risking Rules)
Tail-risk hedging cost 1.5-2.5% of AUM annually in 2025 for a 3-5% monthly drawdown protection. The 2026 play is structured: buy out-of-the-money puts on the S&P 500 (10-15% below spot) and short-dated VIX calls (30-40 strike). Cost: 0.5-1% of AUM.
Listed proxies: SPY put spreads, VIX call spreads. Private: Tail-risk funds (Universa, 36 South) with 8-12% annualized returns over full cycle.
Underwrite: Allocate 1-3% of AUM. Define re-risking rules: after a 10% equity drawdown, reduce tail hedge by 50% and redeploy into equities. After a 20% drawdown, liquidate entirely and rebalance.
2) Liquid-Market Playbook for 2026
Japan Equities: Governance Is a Real Catalyst
The Tokyo Stock Exchange's push on capital efficiency is not a slogan. As of April 2026, all Prime-listed companies must file English-language disclosures and publish ROE targets. The TSE's "Name and Shame" list—companies trading below 1x P/B with ROE under 8%—has grown to 1,200 names, up from 800 in 2024.
The results: 42% of Prime-listed companies have announced share buybacks or dividend increases since 2023. The TOPIX returned +18.2% in 2025 (in yen terms), +12.4% in USD terms. Foreign ownership hit 32% as of Q4 2025, the highest since 2014.
Key sectors: Financials (Mitsubishi UFJ, Sumitomo Mitsui) trade at 0.7-0.9x P/B with 4-5% dividend yields. Industrials (Fanuc, Keyence) benefit from automation demand. Tech (Tokyo Electron, Advantest) rides AI chip equipment capex.
Risks: Yen strength—if USD/JPY falls from 150 to 130, TOPIX returns in USD terms drop 13%. Hedge via USD/JPY forwards or options.
Altss data: 22% of SFOs with >$200M AUM have a Japan equity allocation of 5-15% of public equities, up from 12% in 2023. The median allocation is 8%.
U.S. Equities: Sector Rotation Within AI
The S&P 500 returned +12.3% in 2025, but dispersion was extreme. The Mag 7 returned +28.4% (led by Nvidia at +42%, Meta at +35%), while the equal-weight S&P 500 returned +6.1%. The 2026 play is rotation: from AI infrastructure (Nvidia, Broadcom) to AI applications (Salesforce, Adobe, ServiceNow).
Why: Nvidia's data center revenue grew 112% in fiscal 2025 to $130B. But Blackwell's 2026 ramp may slow to 40-50% growth as hyperscalers optimize utilization. Meanwhile, enterprise AI software revenue is growing 35-40% annually (IDC, 2026).
Sector allocation: Overweight technology (25% vs. 22% benchmark), healthcare (18% vs. 14%), industrials (12% vs. 10%). Underweight consumer discretionary (8% vs. 12%), real estate (2% vs. 4%).
Risk: AI capex disappointment. If Big Tech capex guidance for 2026 comes in below $280B, the AI trade unwinds. Hedge via put spreads on SMH (semiconductor ETF) or short NVDA calls.
European Equities: Value Play with Political Risk
The STOXX 600 returned +9.8% in 2025 (in EUR terms), +5.2% in USD terms. Valuations are cheap: 14.2x forward earnings vs. S&P 500's 22.1x. But political risk is elevated: French elections in 2027, German coalition instability, Italian sovereign spreads at 180bp vs. Bunds.
Key sectors: Healthcare (Novo Nordisk, AstraZeneca) benefits from GLP-1 drug demand. Industrials (Siemens, Schneider Electric) ride electrification and automation. Defense (Rheinmetall, Thales) benefits from NATO spending commitments.
Risks: EUR strength—if EUR/USD rises from 1.08 to 1.15, STOXX returns in USD terms drop 6%. Hedge via EUR/USD forwards.
Altss data: 15% of SFOs with European exposure have reduced allocations by 3-5% since Q3 2025, citing political uncertainty. Those maintaining exposure favor large-cap multinationals with USD-denominated revenue.
Emerging Markets: Selective, Not Broad
EM equities returned +8.4% in 2025 (MSCI EM Index), but dispersion was extreme. India returned +14.2%, Taiwan +12.8%, Brazil +6.1%, China -2.3%. The 2026 play is selective: overweight India and Taiwan, underweight China and Brazil.
India: GDP growth of 6.5% (IMF, 2026), corporate earnings growth of 15-18%, and a domestic savings base that funds 80% of investment. Key sectors: financials (HDFC Bank, ICICI Bank), technology (Infosys, TCS), consumer (Hindustan Unilever).
Taiwan: TSMC's AI-related revenue grew 45% in 2025 to $35B. The stock trades at 22x forward earnings—expensive but justified by 20%+ EPS growth. Risk: China tension.
China: Avoid. GDP growth is 4.5% (IMF), property sector remains depressed (60% of homebuilders are technically insolvent), and regulatory risk is unpredictable. The CSI 300 returned -2.3% in 2025 and is down 15% from 2021 highs.
Brazil: Selective. Petrobras trades at 3.5x earnings with 12% dividend yield, but political risk (Lula's third term) and fiscal deficits (8% of GDP) cap upside.
Fixed Income: Barbell Strategy
#### Short Duration (1-3 Years): Carry
U.S. IG credit: 4.5-5.5% yields, 1.2x leverage, 0.5% default rates. Favor financials (JPMorgan, Goldman Sachs) and technology (Microsoft, Apple). Avoid retail and healthcare—default rates are 2-3%.
European IG: 3.5-4.5% yields, 1.0x leverage. Favor German bunds (0.5% yield) for safety, French OATs (3.2% yield) for carry.
EM hard currency: 6-8% yields on BB-rated sovereigns (Indonesia, Mexico, Saudi Arabia). Favor short-dated (1-3 year) bonds to reduce duration risk.
#### Long Duration (20-30 Years): Convexity
U.S. Treasuries: 4.2-4.8% yields on 30-year bonds. If the Fed cuts 50bp, 30-year yields fall to 3.7-4.3%, generating 15-20% price appreciation. If rates rise 50bp, you lose 10-15%. The play is a tail hedge, not a core holding.
TIPS: 10-year TIPS yield 1.8% real—attractive for inflation protection. Allocate 5-10% of fixed income.
#### High Yield: Selective
U.S. high yield: 7.5-8.5% yields, 2.8% default rate (Moody's, 2026). Favor BB-rated energy (Pioneer Natural Resources, EOG Resources) and technology (Dell, HP). Avoid CCC-rated retail and healthcare.
European high yield: 6-7% yields, 2.5% default rate. Favor BB-rated telecom (Deutsche Telekom, Orange) and utilities (Enel, Iberdrola).
EM local currency: 8-12% yields on Brazil (Selic at 14.25%), Mexico (Banxico at 10.5%), and India (RBI at 6.25%). But FX risk is significant—hedge via NDFs or currency swaps.
3) Private-Markets Playbook for 2026
Venture Capital: AI Concentration, But Dispersion
VC deployed $79B in H1 2025, with 42% going to AI companies. The top 10 deals accounted for 35% of dollars: Anthropic ($2B), CoreWeave ($1.5B), Databricks ($1.2B), Scale AI ($1B), xAI ($750M), etc.
The 2026 play is not the mega-rounds—they're priced for perfection (Anthropic at 30x revenue). Instead, focus on AI infrastructure (compute, data centers, networking) and AI applications in verticals (healthcare, legal, manufacturing).
Key sectors: AI infrastructure (CoreWeave, Lambda), healthcare AI (PathAI, Viz.ai), legal AI (Harvey, EvenUp), manufacturing AI (Covariant, Bright Machines).
Stage preference: Series B-D with $50M-$200M check sizes and 12-18 months of runway. Avoid pre-revenue seed deals—the failure rate is 75%+.
Altss data: 32% of SFOs with >$500M AUM have a VC allocation of 5-15% of private markets, with 60% targeting AI-related deals. The median check size is $5M-$15M per deal.
Growth Equity: The Sweet Spot
Growth equity (Series C-D, $100M-$500M revenue) returned 14.2% in 2025 (Cambridge Associates U.S. Growth Equity Index). The sweet spot is companies with >30% revenue growth, >60% gross margins, and a clear path to profitability within 24 months.
Key sectors: Enterprise AI (Databricks, Snowflake), fintech (Stripe, Plaid), healthcare (Ro, Hims & Hers), cybersecurity (Wiz, Lacework).
Underwrite: Require >$100M ARR, >30% net dollar retention, and >50% gross margins. Avoid companies with >5x net debt/EBITDA or negative operating cash flow for >3 years.
Altss data: 28% of SFOs with >$200M AUM participate in growth equity co-investments, with a median check size of $10M-$25M. The preferred structure is direct co-investment (60%) vs. fund-of-funds (40%).
Private Equity: Vintage Pacing
PE returned 9.2% in 2025 (Cambridge Associates U.S. PE Index). But dispersion is wide: top-quartile funds returned 18.4%, bottom-quartile returned 2.1%. The key is vintage pacing: commit 10-15% of AUM annually across vintages.
2026 vintage: Attractive entry point. Valuations are 11.2x EBITDA (S&P LCD), down from 12.5x in 2021. Debt markets are open (7.5-8.5% yields on leveraged loans). Exit environment is improving—PE-backed IPOs raised $45B in 2025, up from $28B in 2024.
Key strategies: Buyout (mid-market, $500M-$2B enterprise value), growth equity (as above), special situations (distressed debt, turnaround).
Fund selection: Focus on managers with >15% net IRR across vintages, >2x MOIC, and >75% of exits via strategic sale or IPO. Avoid first-time funds with no track record—failure rate is 40%+.
Real Estate: Selective, Not Broad
Real estate returned -2.3% in 2025 (NCREIF ODCE Index). Office values are down 35% from peak, retail is down 20%, but industrial is up 15% and multifamily is flat.
2026 play: Industrial (warehouses, logistics), data centers, and student housing. Avoid office, retail, and hospitality.
Industrial: Vacancy rates are 4.5% (CBRE, 2026), rent growth is 8-10% annually. Key markets: Inland Empire, Dallas, Atlanta, Chicago.
Data centers: 12-15% cap rates, 10-15 year leases, 5-7% annual rent escalations. Key markets: Northern Virginia (constrained), Ohio, Indiana, Texas.
Student housing: 95% occupancy, 5-7% rent growth. Key markets: Austin, Nashville, Columbus.
Altss data: 18% of SFOs have a real estate allocation of 5-15% of total AUM, with 50% targeting data centers and industrial. The median equity check is $20M-$50M per deal.
Infrastructure: Energy Transition
Infrastructure returned 10.5% in 2025 (EDHEC Infra Index). The 2026 play is energy transition: renewable energy, transmission, and energy storage.
Renewables: Solar and wind are 3-5% yields, but face grid interconnection delays. Favor projects with secured PPAs and 10-15 year offtake agreements.
Transmission: 8-12% yields, but 4-7 year development timelines. Favor projects with regulatory approval and cost-of-service rate recovery.
Energy storage: 10-15% yields, but technology risk (lithium-ion vs. long-duration alternatives). Favor projects with 4-8 hour discharge duration and 10-15 year contracts.
Altss data: 25% of SFOs have an infrastructure allocation of 5-10% of total AUM, with 60% targeting energy transition. The median equity check is $15M-$40M per deal.
4) The Fund Manager's Playbook: How to Raise Capital in 2026
Know Your LP Base
The 2026 fundraising environment is bifurcated. Top-quartile managers close in 12-14 months with 90%+ target. Bottom-quartile managers take 18-24 months and hit 60-70% of target.
The key is knowing which LPs are in market. Altss tracks 30,000+ institutional investors, RIAs, and family offices, with sub-30-day refresh cycles on LP data. The platform shows that 42% of SFOs plan to increase PE allocations in 2026, while 28% plan to decrease VC allocations.
Target LPs: SFOs with >$500M AUM, endowments with >$1B, and pension funds with >$5B. Avoid sovereign wealth funds—they're oversubscribed and have 2-3 year due diligence timelines.
Craft the Narrative
Your pitch must answer three questions:
- Why this vintage? "Valuations are 11.2x EBITDA, down from 12.5x in 2021. Debt markets are open. Exit environment is improving. This is the best entry point since 2020."
- Why this strategy? "We target mid-market buyouts in healthcare and technology. Our 15-year track record shows 18% net IRR, 2.5x MOIC, and 85% of exits via strategic sale."
- Why this team? "Our three partners have 25+ years of combined experience. We've invested together for 10 years. Our reference LPs include [names]."
Use Data to Differentiate
In 2026, LPs expect data-driven pitches. Show:
- Vintage analysis: "Our 2020 vintage returned 22% net IRR vs. Cambridge Associates benchmark of 15%."
- Sector specialization: "60% of our deals are in healthcare IT, where we have proprietary sourcing from 20+ industry advisors."
- Exit track record: "Our last three exits closed at 3.2x, 2.8x, and 4.1x MOIC, with an average hold period of 4.2 years."
Leverage Altss for Pipeline
Altss maps who is allocating to what (mandates, closes, co-invest patterns). The platform shows that 34% of SFOs with >$500M AUM have a healthcare PE mandate in 2026, up from 22% in 2024. If you're raising a healthcare fund, target these LPs first.
5) The Emerging GP Playbook: How to Break In
Start with Co-Investments
Emerging GPs (first-time funds) face a 40% failure rate. The 2026 play is to build a track record via co-investments before launching a fund.
How: Partner with an established GP on a deal-by-deal basis. Take a minority stake (5-15%) and participate in governance. After 3-5 successful deals (2x+ MOIC), you have a track record.
Altss data: 22% of SFOs participate in co-investments with emerging GPs, with a median check size of $3M-$10M. The preferred structure is a sidecar vehicle with 10-15 LPs.
Target Niche Strategies
Emerging GPs succeed by specializing. The 2026 niches:
- AI for healthcare: "We invest in AI-native healthcare companies that reduce costs 30%+."
- Energy transition infrastructure: "We develop and operate community solar and battery storage projects in the U.S. Southeast."
- ESG-linked private credit: "We provide asset-backed loans to European mid-market companies with verifiable ESG improvements."
Build a Reference Set
LPs require 3-5 reference calls with investors who've co-invested with you. If you have no track record, partner with a platform fund (e.g., StepStone, Hamilton Lane) that provides co-investment capital and LP introductions.
Use Altss for LP Targeting
Altss tracks 9,000+ family offices globally. Filter by: AUM (>$500M), strategy (co-investments, emerging managers), geography (U.S., Europe, Asia), and mandate (healthcare, technology, energy). The platform shows that 18% of SFOs with >$200M AUM have a dedicated emerging manager allocation.
6) Risk Management for 2026
Tail Risks
- AI capex disappointment: If Big Tech capex guidance for 2026 comes in below $280B, the AI trade unwinds. Hedge via put spreads on SMH or short NVDA calls.
- Japan financial crisis: If the BOJ hikes to 1.0% and JGB yields spike to 2.5%, Japanese banks face losses on their bond portfolios. Hedge via CDS on Japanese financials.
- China-Taiwan conflict: If China invades Taiwan, global semiconductor supply shuts down. Hedge via long-dated puts on TSMC and short-dated VIX calls.
- U.S. fiscal crisis: If the U.S. debt-to-GDP ratio hits 120% (it's 98% in 2026) and Treasury auctions fail, yields spike. Hedge via long-dated Treasuries (convexity) or CDS on U.S. sovereign.
Operational Risks
- Cybersecurity: 60% of family offices experienced a cyber incident in 2025 (KPMG survey). Mitigate via multi-factor authentication, dedicated cybersecurity insurance ($5M-$10M coverage), and quarterly penetration testing.
- Key-person risk: 40% of SFOs have no succession plan for the CIO. Mitigate via documented investment process, institutional knowledge transfer, and a board of advisors.
- Liquidity risk: 25% of SFOs have >30% of AUM in illiquid assets. Mitigate via cash flow modeling (10-year horizon) and a liquidity reserve (10-15% of AUM in cash equivalents).
7) Technology Stack for 2026
LP/GP Intelligence
Altss provides AI-verified LP/GP intelligence on 30,000+ institutional investors, RIAs, and family offices. The platform tracks 150,000+ private-markets entities with sub-30-day refresh cycles.
Key features: LP mandates (sector, geography, check size), co-investment patterns, fund closes, and capital formation trends. Institutional LP coverage went live in February 2026.
Portfolio Management
Preferred platforms: Addepar (wealth management), iCapital (alternative investments), Canoe (document processing). Integration with Altss for LP data.
Data Analytics
Preferred platforms: Bloomberg Terminal (public markets), PitchBook (private markets), Preqin (fund data). Altss complements with LP/GP intelligence not available on these platforms.
Cybersecurity
Preferred platforms: CrowdStrike (endpoint protection), Okta (identity management), Vanta (SOC 2 compliance). Altss uses SOC 2 Type II in progress with Vanta.
8) Case Studies: How Family Offices Are Allocating in 2026
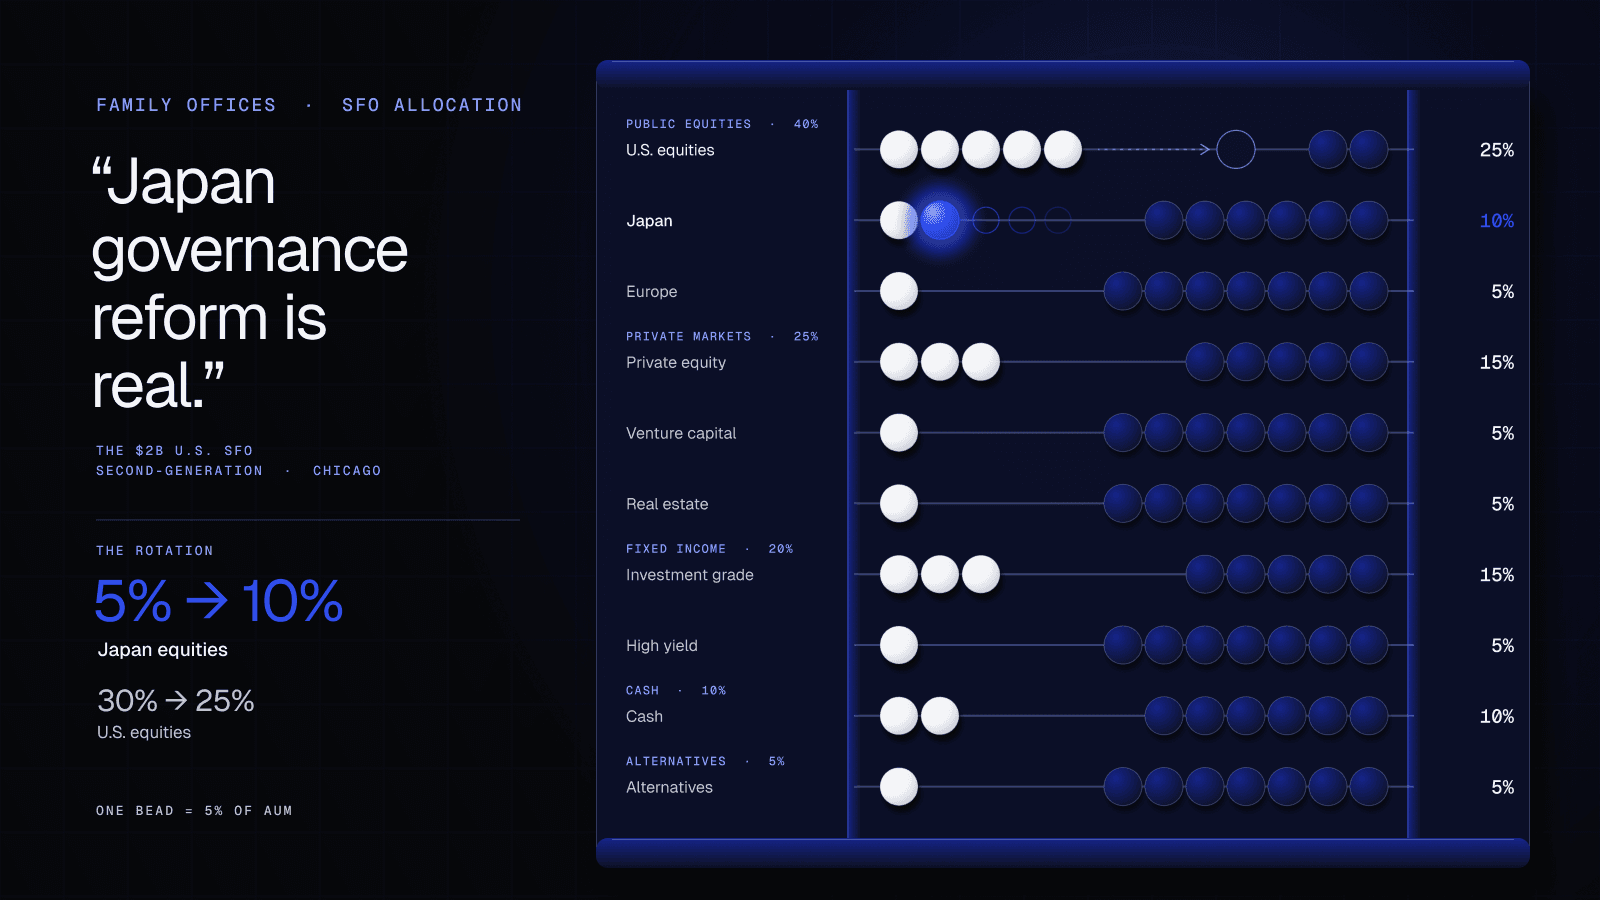
Case Study 1: The $2B U.S. SFO
Profile: Second-generation family office, $2B AUM, single-family, based in Chicago.
Allocation: 40% public equities (25% U.S., 10% Japan, 5% Europe), 25% private markets (15% PE, 5% VC, 5% real estate), 20% fixed income (15% IG, 5% HY), 10% cash, 5% alternatives (managed futures, cat bonds).
2026 changes: Increased Japan equities from 5% to 10%, reduced U.S. equities from 30% to 25%, added managed futures (3% of AUM).
Why: "Japan governance reform is real. We're buying financials and industrials. Managed futures give us crisis alpha."
Case Study 2: The $500M European SFO
Profile: Third-generation family office, $500M AUM, based in Zurich.
Allocation: 35% public equities (15% Europe, 10% U.S., 10% EM), 20% private markets (10% PE, 5% VC, 5% infrastructure), 25% fixed income (15% IG, 10% HY), 10% cash, 10% alternatives (gold, reinsurance).
2026 changes: Reduced European equities from 20% to 15%, increased EM equities from 5% to 10% (India and Taiwan), added infrastructure (5% in energy transition).
Why: "Europe is cheap but politically risky. India and Taiwan offer better growth. Infrastructure gives us inflation-linked cash flows."
Case Study 3: The $1B Asian SFO
Profile: First-generation family office, $1B AUM, based in Singapore.
Allocation: 30% public equities (15% Asia ex-Japan, 10% U.S., 5% Japan), 30% private markets (15% VC, 10% PE, 5% real estate), 20
Find the allocators who actually back funds like yours
GPs and IR teams use Altss to research allocators with ownership, commitment, transaction and relationship context, then prioritize outreach.


See the allocators behind your next close.
Public records carry source-specific dates where available. No population-wide measured refresh cadence or universal verification deadline is established here. Page modified, source captured, fact observed, entity verified and aggregate measured describe different events. Check the date attached to the relevant claim; a missing verification date means unknown. Stored source history does not establish a customer-facing historical-analysis interface.