


Private fund formation set a Q1 record in 2026. 5,765 Form D filings hit SEC EDGAR, up 9% year-over-year. Private equity raised $39.4 billion across 156 reported raises; venture capital raised $6.3 billion across 165. Same fund count, six times the capital. Nine of the 15 largest PE raises were private credit or secondaries vehicles. First-time EDGAR filers dropped 12.8% to 1,659, with emerging VC fund formation down 20% even as emerging PE formation rose 45%. The market is consolidating into proven credit and secondaries platforms — not backing new venture brands.
A record Q1 for private-fund formation
The 5,765 Form D filings in Q1 2026 are the most Altss has recorded for any first quarter. Q1 2025 — itself a surge year — saw 5,287. Q1 2024: 2,592. Q1 2023: 2,205. Q1 2022: 3,110. On raw count alone, filings have nearly doubled since early 2023.
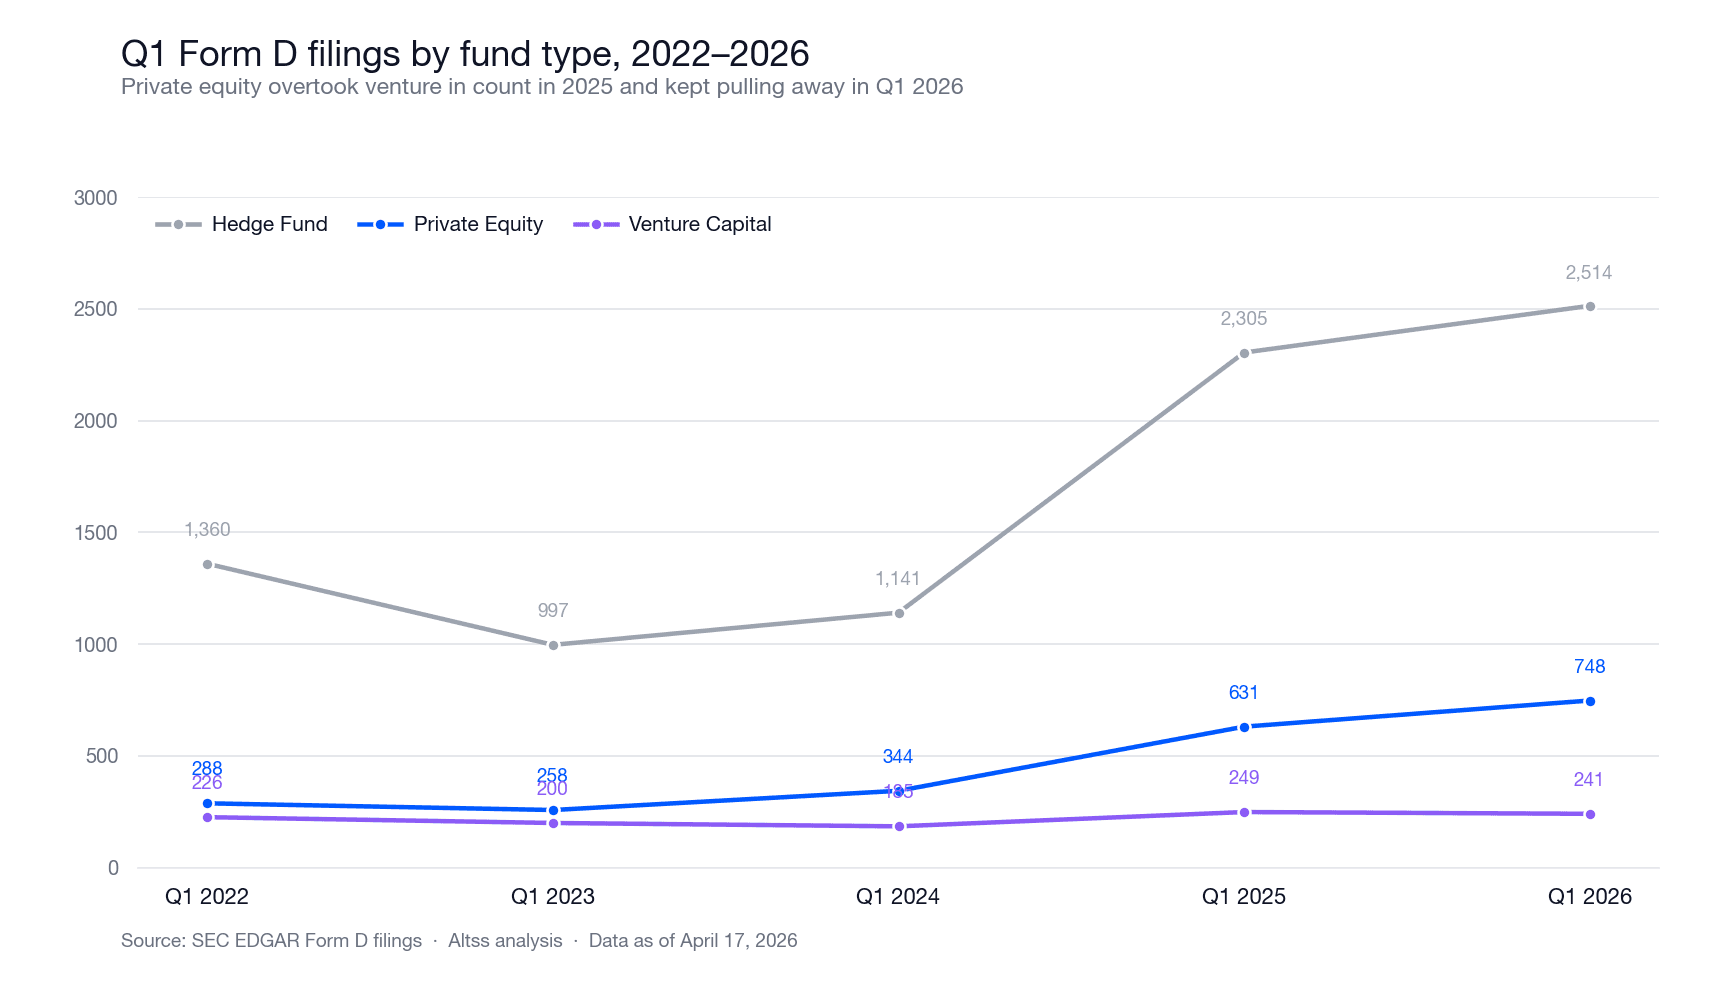
The growth is not evenly distributed across fund types. Hedge funds drove most of the total-filings gain between Q1 2024 and Q1 2025 and continued to dominate the count in Q1 2026 (2,514 filings, up 9.1% YoY). Private equity moved from 344 Q1 2024 filings to 631 in Q1 2025 to 748 in Q1 2026 — an unbroken climb. Venture capital went the other way: 185 to 249 to 241, the first YoY decline in the Altss corpus.
Even within fund types, Q1 2026 is the new high: the largest PE Q1, the largest hedge-fund Q1, the first VC decline. If private-markets fund formation was widely expected to soften in 2026 — the narrative coming out of late 2025 — the data so far does not support that read. The underlying market is growing. What's changed is where the dollars are going.
PE raised six times VC's capital with a near-identical fund count
Across the 748 Q1 2026 Private Equity Fund filings, 156 reported a specific total offering amount summing to $39.4 billion. Across the 241 Venture Capital Fund filings, 165 reported amounts summing to $6.3 billion. Same fund count, six times the capital.
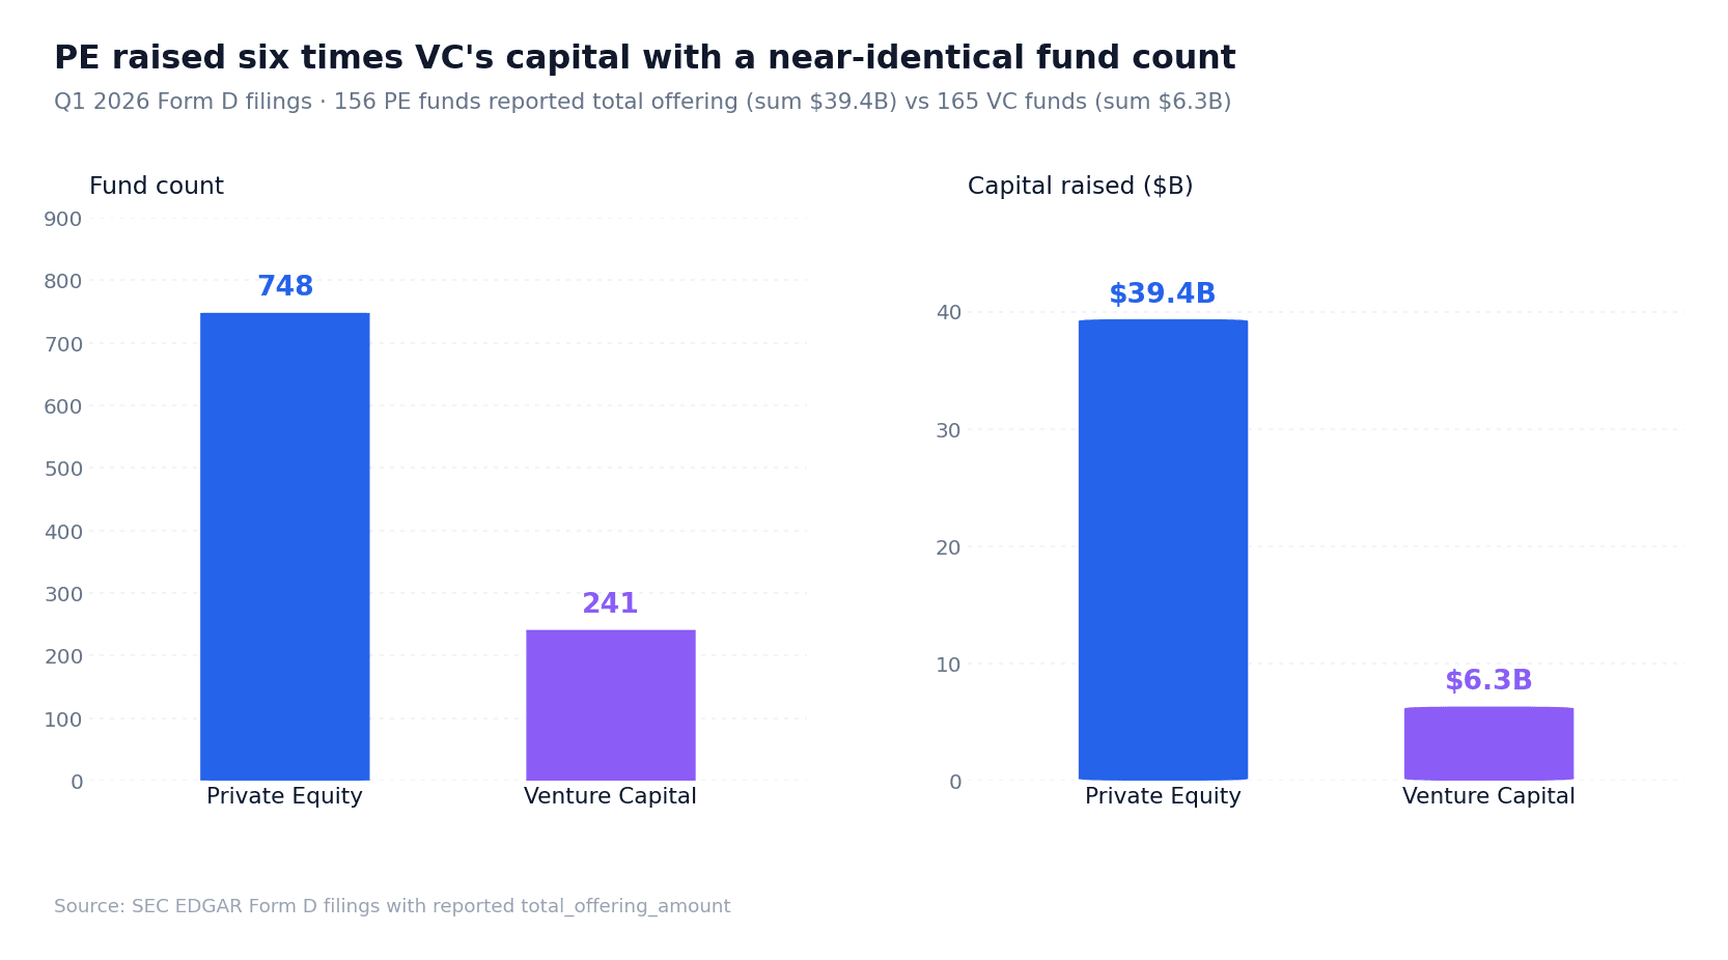
Median PE raise: $55 million. Median VC raise: $9.4 million. Mean PE raise: $252 million. Mean VC raise: $38 million. Both distributions are heavy-tailed — a handful of mega-raises on the PE side (Manulife, Blue Torch, Canyon) pull the mean — but the medians alone capture a six-to-one gap in typical fund size.
This is not the first quarter PE has outweighed VC on dollars. VC has been smaller-per-fund for years. What is new: VC has lost its fund-count advantage. In Q1 2022 and Q1 2023, VC outfiled PE. In Q1 2025, PE crossed VC in count for the first time (631 vs 249, a 2.5× gap). In Q1 2026, PE is 3.1× VC on count and 6.25× on capital. The convergence on count was already the story of 2025; the Q1 2026 continuation confirms the trend is structural, not a one-quarter artifact.
The PE surge is private credit and secondaries, not buyout
Among the 15 largest Q1 2026 Private Equity Fund filings by total offering amount, nine are best described as private credit or secondaries vehicles. Traditional leveraged-buyout funds barely register at the top.
Top Q1 2026 PE raises by reported offering size
- Manulife Infrastructure Fund III — $3.58B (MA, Infrastructure)
- Blue Torch Credit Opportunities Fund IV and its offshore twin — $3.00B each (NY, Private credit)
- Canyon Lending Offshore Feeder Fund II — $1.50B (TX, Direct lending)
- Bain Capital Double Impact Fund III — $1.32B (MA, Impact PE)
- Apogem Secondary Fund VII — $1.30B (NY, Secondaries)
- Valor Atreides AI I — $0.76B (IL, AI-themed PE)
- Waterfall Private Asset-Backed Credit Fund I, three parallel vehicles — $0.75B each (NY/Cayman, Asset-backed credit)
- HighVista Private Equity XI — $0.72B (MA, PE fund-of-funds)
- Eagle Point Defensive Income Fund III, three parallel vehicles — $0.60B each (CT, Credit)
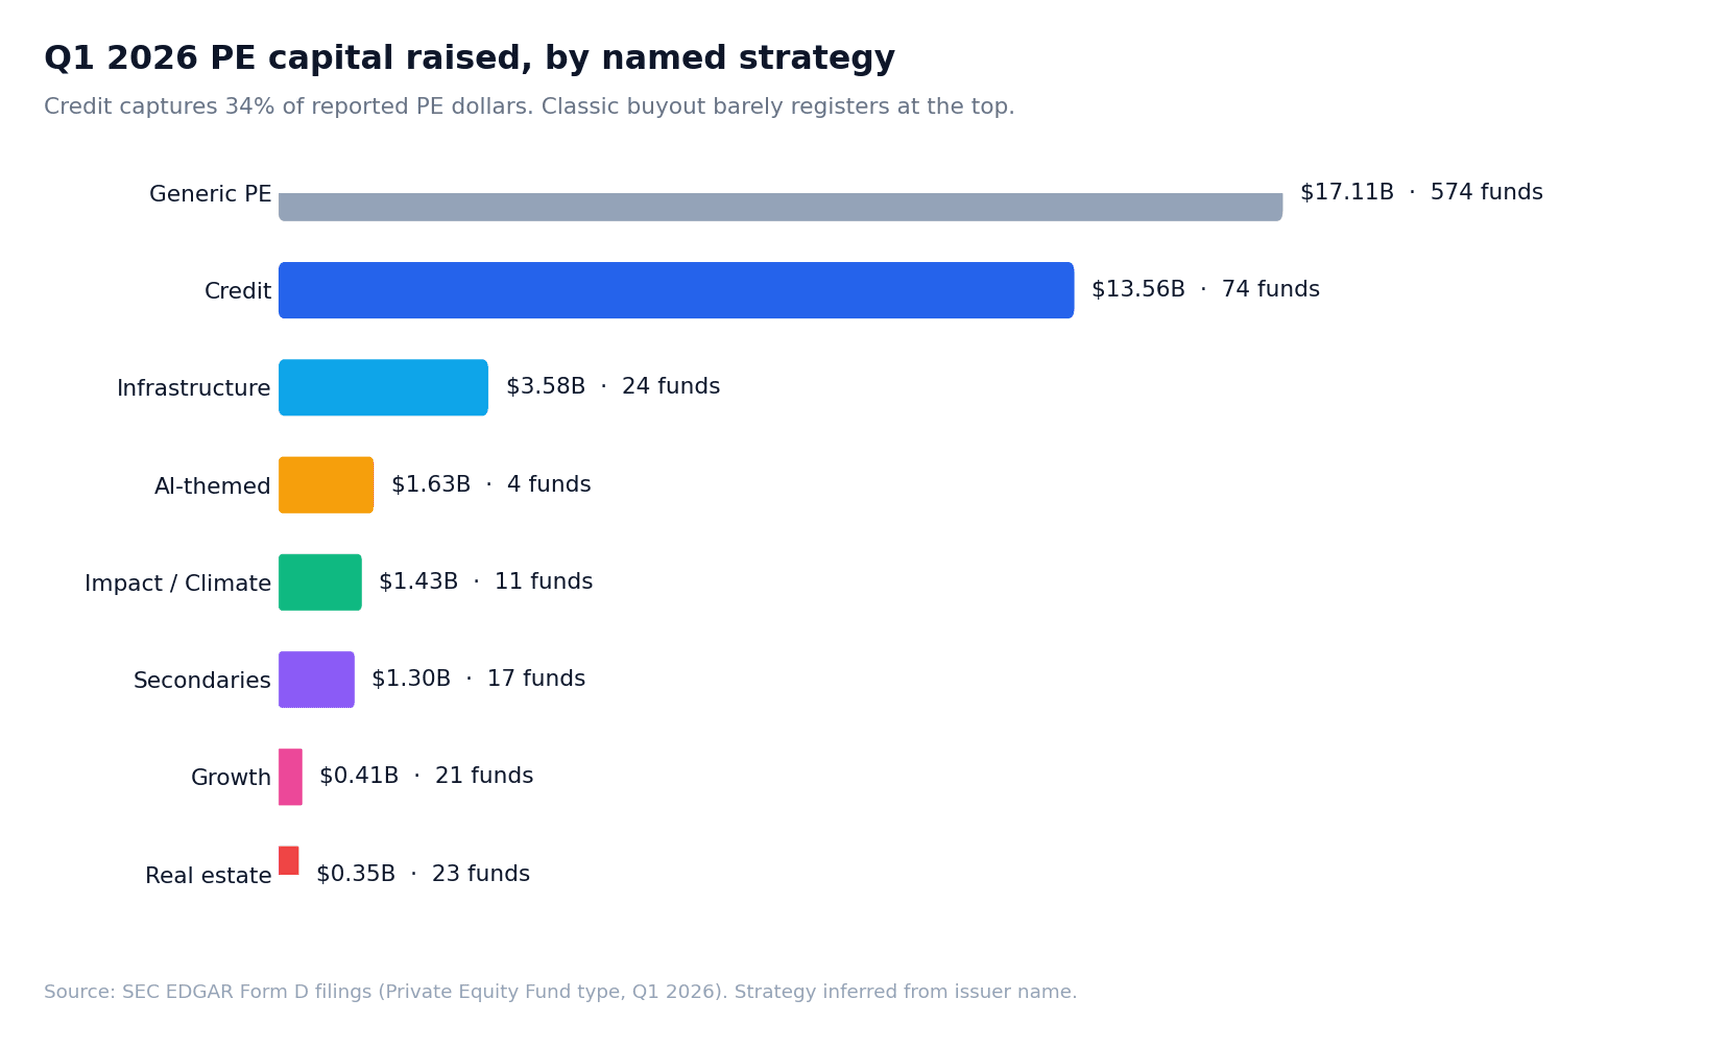
Classifying all 748 Q1 2026 PE filings by naming pattern, 74 credit-strategy funds raised $13.56 billion — 34% of the PE-cohort total. Another 17 secondaries funds raised $1.30 billion. 24 infrastructure funds raised $3.58 billion, concentrated in Manulife's single vehicle. Four AI-themed PE funds raised $1.63 billion. Eleven impact or climate funds raised $1.43 billion.
The remaining 570 generic PE filings raised $17.11 billion. Inspected individually, many are mid-market platforms, continuation vehicles, or credit sleeves that don't carry a strategy keyword in the issuer name — which means the true share of credit-and-secondaries capital is higher than the headline 34%, not lower.
Credit, secondaries, and infrastructure combined capture roughly $18.4 billion in Q1 2026 alone — nearly half of all reported PE dollars. Eleven of the top 20 PE raises use Cayman offshore feeders, confirming institutional-LP participation. Across the 156 sized PE filings, the median investor count sits in the 20–40 range — club-deal and institutional territory, not retail.
The implication for traditional buyout is uncomfortable. Either classical buyout is operating on reserves from prior vintages and filing less in Q1, or it is losing share to the new PE sub-asset classes at scale. Both readings carry the same directional consequence: the PE sub-asset mix is shifting toward credit, and the institutional platforms scaled to absorb it — Blue Torch, Waterfall, Apogem, Canyon, Eagle Point — are filing at the same scale and frequency as peak buyout did in prior cycles.
Credit is no longer the specialty sleeve inside PE. It is PE.
VC didn't die. It compressed.
The 3.2% drop in VC fund count understates the shift. Mega-VC raises are still happening: Series X Capital Fund I topped the Q1 2026 VC table at $541.7 million — notably, a first-fund raise at a size that would have been headline news during peak 2021. Lee Fixel's Addition Five Partners filed at $225 million. Kindred Ventures IV at $230 million. TQ Ventures III Growth at $346 million. Glasswing Ventures III at $203 million. Soma Capital Fund IV at $200 million.
What these Q1 2026 VC names share: brand-name GPs with prior-fund track records, clear sector or stage specialization, and — with the exception of Series X — raise sizes that are flat-to-down relative to their predecessor funds. Mega-VC capital is being written to the same roster of brands LPs already know.
What's missing from the Q1 2026 VC table is the middle. The $50–150 million first-and-second funds that defined VC expansion from 2019 to 2022 are not raising at prior rates. The median Q1 2026 VC raise is $9.4 million — a level consistent with friends-and-family pre-fund vehicles rather than institutional fund sizes. The modal VC raise is even smaller.
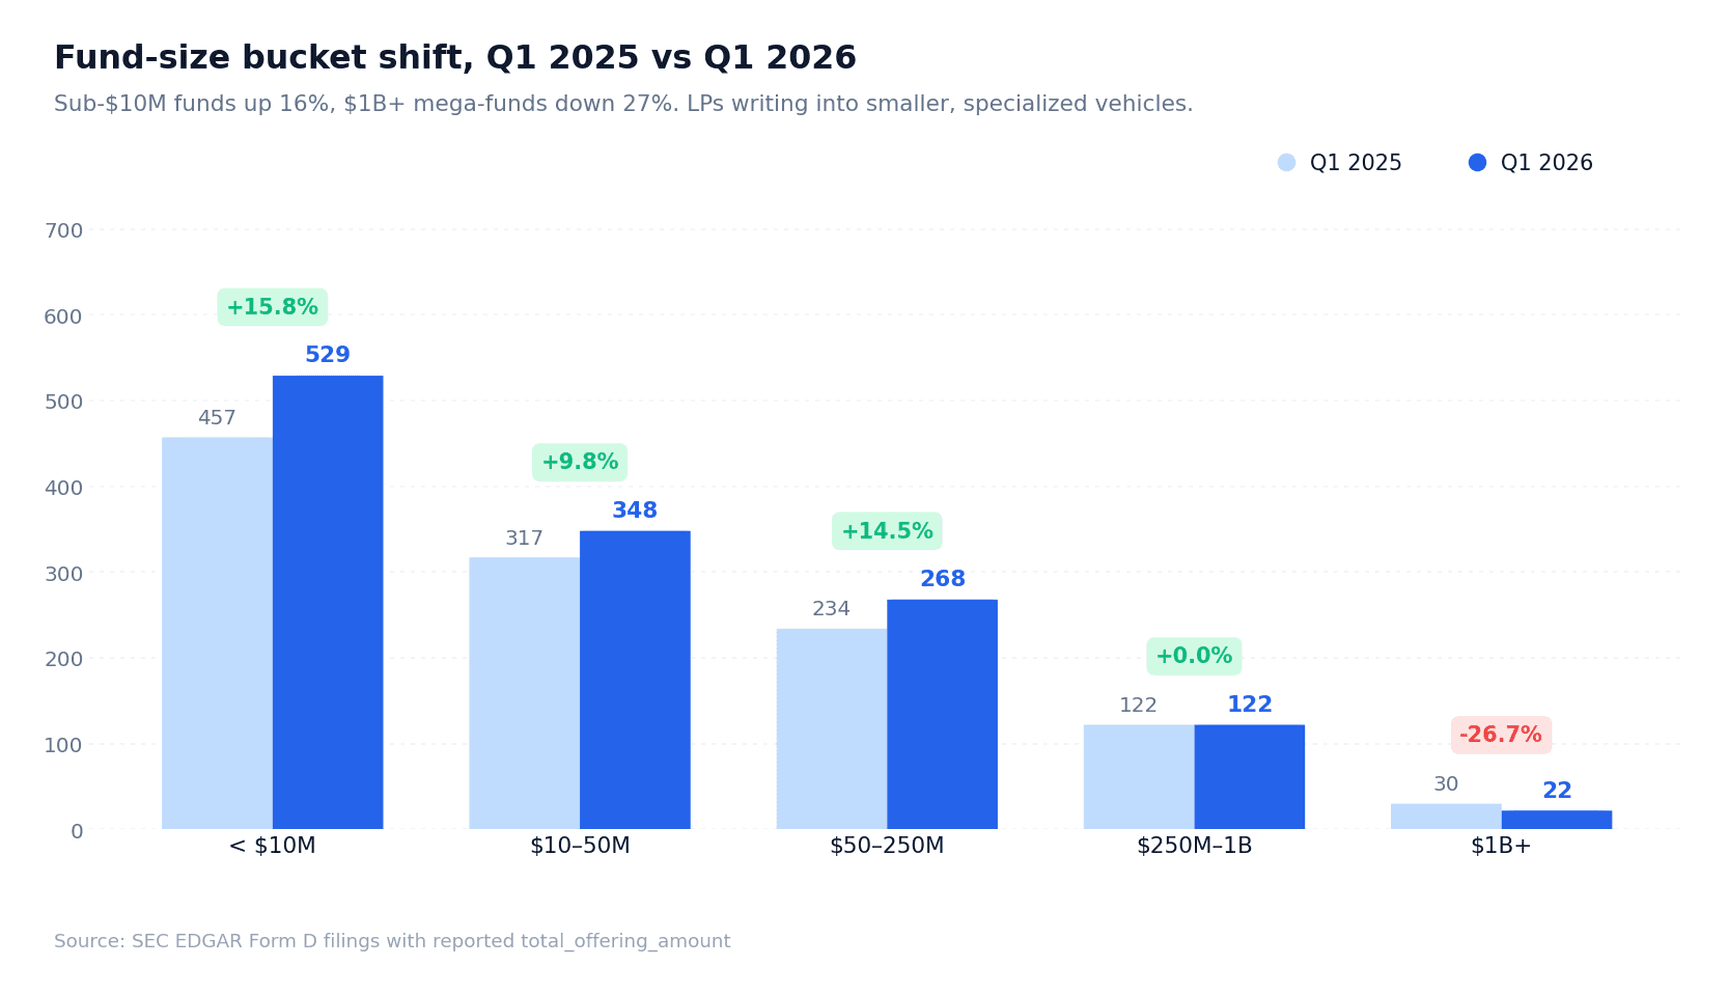
Across all fund types, the size distribution shifted meaningfully in Q1 2026. Sub-$10M filings grew 15.8% YoY. $50–250M filings grew 14.5%. $1B+ filings contracted 26.7% — from 30 mega-raises in Q1 2025 to 22 in Q1 2026. The middle swelled, the extremes thinned. The $1B+ decline is particularly notable: it includes the tier where buyout mega-funds typically show up, and its Q1 2026 contraction is the largest category move in the data.
New-manager entry is tightening
1,659 CIKs filed Form D for the first time in Q1 2026 — down 12.8% from 1,903 in Q1 2025. Against the backdrop of overall filings growing 9%, this is the clearest signal in the quarter that the market is consolidating. New managers entered at a lower rate than established managers filed parallel, amendment, or successor vehicles.
The dynamic inside the emerging-manager cohort — filings with Fund I or Fund II in the issuer name — reveals a second rotation.
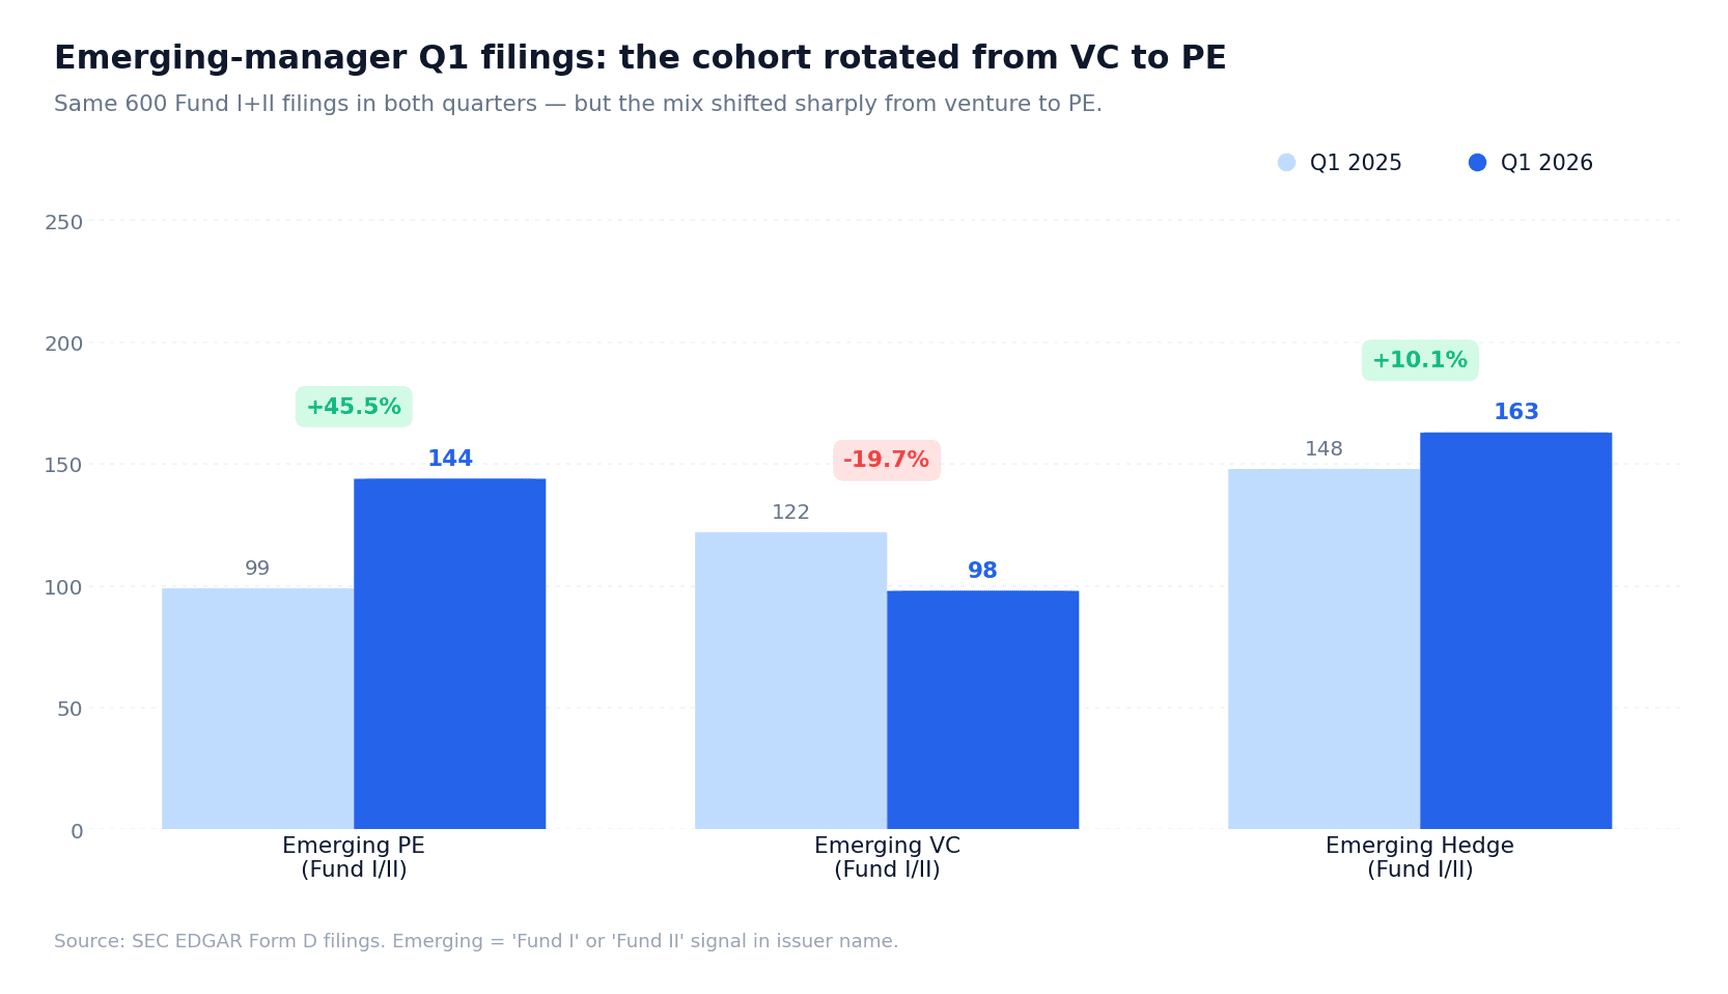
The number of Fund I/II filings is identical across the two quarters: 600 in Q1 2025, 600 in Q1 2026. But within that constant total, emerging PE filings rose from 99 to 144 (+45.5%) while emerging VC filings fell from 122 to 98 (-19.7%). Emerging hedge funds were roughly flat.
New GPs who a year earlier might have formed a venture fund are now forming PE funds. In absolute terms, emerging PE Fund Is and IIs now outnumber emerging VC Fund Is and IIs by 47%. A year ago, they were 23% below VC. This is a full rank-order flip in twelve months.
The reshaping is happening at both ends of the manager hierarchy: at the brand tier, LP capital is concentrating into known VC names; at the emerging tier, new GPs are choosing PE structures over VC. The middle of the VC market — the $50–150M institutional-first-fund segment — is where the pressure is highest.
Geography: Texas, Delaware, and Connecticut are where PE is forming
New York remains the capital of private-fund formation. 1,253 Q1 2026 filings originated from NY issuers, up 14.5% YoY. California, the historical second-place state, dropped to 569 filings, down 3.6% — a decline that tracks VC's broader compression given California's heavy weighting toward venture (52 of its 569 filings were VC, the largest VC concentration of any state).
Top 9 states by Q1 Form D filings, YoY
- New York — 1,094 to 1,253 (+14.5%)
- California — 590 to 569 (-3.6%)
- Texas — 319 to 387 (+21.3%)
- Florida — 312 to 301 (-3.5%)
- Massachusetts — 251 to 257 (+2.4%)
- Connecticut — 198 to 250 (+26.3%)
- Illinois — 219 to 221 (+0.9%)
- Delaware — 81 to 155 (+91.4%)
- Pennsylvania — 128 to 154 (+20.3%)
Delaware's 91.4% jump is partly mechanical — Delaware LPs are the structural vehicle of choice for PE parallel feeders — but a near-doubling in one year is meaningful on any reading. Connecticut (Eagle Point, other credit platforms) and Texas (PE growth; 63 Texas PE filings in Q1 2026 vs 49 in Q1 2025) are the consistent growth states. California's decline is the outlier.
For allocator GP mapping, the Texas–Connecticut–Pennsylvania–Delaware corridor is increasingly where PE formation occurs. For VC-focused coverage, California remains the gravitational center — but with thinner activity than in 2024.
What this means for allocators
Three takeaways for allocators managing private-markets books.
Credit and secondaries deserve a dedicated sleeve. On Q1 2026 formation alone, roughly 34% of PE capital is flowing into credit strategies and another 3% into secondaries. If your current PE allocation mental model treats these as small sub-asset classes, the market has moved past that framing. Credit platforms at $1–3 billion fund sizes are no longer specialty — they are the core PE market. Pacing models built on 2022 composition understate current opportunity set.
New-VC dealflow will be thinner than 2024–2025. Fewer first-fund VC managers means fewer differentiated thesis-driven GPs for LPs to back. Brand-tier VC names are still raising, and LP concentration into those names is intensifying. If your VC mandate prioritizes new managers, expect longer cycles to fill. If it prioritizes brand, expect more competition on access.
Offshore parallels matter. 14% of Q1 2026 filings are non-US offshore structures or explicit Cayman/Bermuda feeders. Allocator discovery filtered on US-onshore only systematically misses institutional-scale raises. Any directory that drops offshore parallels is not capturing the institutional market.
What this means for emerging GPs
Emerging VC is the one category actively contracting YoY. That does not mean the category is closed — several successful Fund Is still raised in Q1 2026 — but LP conviction for new VC brands is softer than in 2022–2024. Differentiation, sector focus, and prior-GP track record carry disproportionate weight. A generalist early-stage VC Fund I thesis faces a stronger competitive set than the top-line VC count suggests.
Emerging credit and secondaries have room. LP appetite is present and the fund count is still small relative to capital. Blue Torch, Waterfall, Apogem, Eagle Point, and Canyon are the scaled incumbents, but the middle of the credit table is thinner than the PE buyout middle ever was. Emerging credit funds filing Fund I or Fund II with clear strategy focus — direct lending, asset-backed, special situations — are raising at median sizes meaningfully above emerging-VC medians.
The quarter in one line
Q1 2026 was the largest first quarter on record for private-fund formation — and the quarter the PE–VC rotation ceased being a 2025 story. Capital has shifted from venture to credit and secondaries, from mega-funds to the mid-market, and from first-time VC brands to first-time PE sponsors. The institutional winners are the scaled credit platforms. The pressure point is the $50–150 million VC middle. LPs are writing fewer, bigger checks into the strategies that have earned their conviction.
Data as of April 17, 2026. Source: SEC EDGAR Form D filings.

