
Sofina H1 2026: fund valuations, cash flows and uncalled capital
Sofina’s H1 2026 fund-value growth differs from cash deployment and uncalled commitments. Reconcile the cash-flow, valuation and obligation bridges.
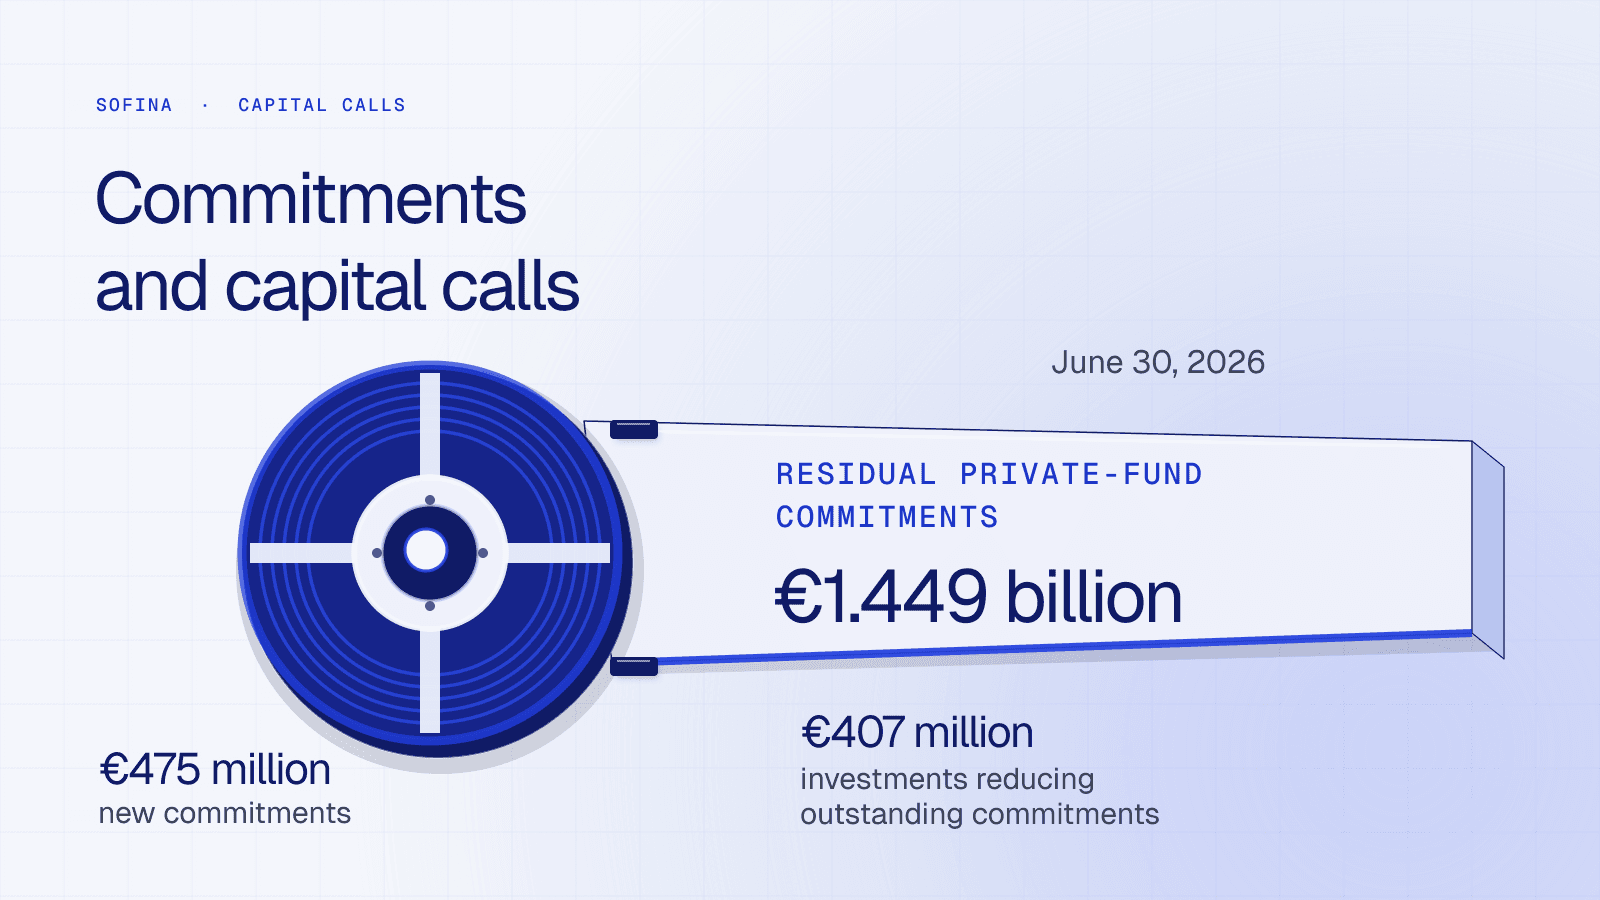
Sofina Private Funds increased in fair value by approximately €1.075 billion in the first half of 2026. Its management cash-flow statement records approximately €224.7 million of net cash invested in those funds. Valuation movements and foreign exchange explain most of the carrying-value increase; a separate €1.449 billion of residual fund commitments describes obligations that remained outstanding at June 30.
For an allocator analyst or a GP assessing Sofina as a prospective LP, those are three different signals. The first describes the value of existing exposure, the second describes cash investment activity, and the third describes commitments still to be called. Treating any one as a substitute for the others changes the apparent scale of the investment program.
Sofina describes itself as a family-run global investment company listed on Euronext Brussels. The half-year report covers the six months ended June 30, 2026; Sofina published it on September 2. Its investment-company NAV and look-through investment portfolio are distinct measures. This is a company-specific analysis of that reporting period, rather than a claim about family-office deployment as a whole.
Fund values rose faster than cash deployment
The report's investment-portfolio bridge puts Sofina Private Funds at €4,893.330 million on December 31, 2025 and €5,968.799 million on June 30, 2026. The difference is €1,075.469 million. Its main components, before rounding to millions, are:
- €400.375 million of cash investments and €6.399 million of non-cash investments.
- €184.017 million of cash divestments and revenues, plus €1.923 million of non-cash divestments and revenues, reducing the balance.
- €690.525 million of market impact and €164.109 million of foreign-exchange impact, increasing the balance.
Combined market and currency movements account for €854.634 million of the bridge. Net investments less divestments and revenues in this bridge account for €220.834 million. The displayed components differ from the change between opening and closing balances by €0.001 million; that small residual is retained rather than forced into a category.
These are changes in the value carried on the portfolio. A currency gain changes the euro value of an existing investment without being a fresh euro commitment to a manager. Likewise, market impact can raise the balance without a corresponding cash outflow. The distinction matters when a larger disclosed fund portfolio is interpreted as evidence of increased purchasing activity.
The €407 million capital-call label needs its definition
Sofina's results presentation summarizes the fund bridge with €407 million of capital calls and €186 million of distributions. Those rounded amounts reconcile to the investment-portfolio bridge: cash and non-cash investments total €406.774 million, while cash and non-cash divestments and revenues total €185.940 million.
The management cash-flow statement on page 25 is a separate disclosure on a look-through basis for all group subsidiaries. Its Private Funds column records €415.027 million of investment outflows and €190.343 million of divestment inflows. Subtracting the latter from the former gives €224.684 million of net cash invested.
The portfolio bridge therefore provides approximately €220.8 million of net investment entries including non-cash items; the management statement provides approximately €224.7 million of net cash investment activity. Keeping the statement names with the amounts avoids turning the presentation's €407 million label into a claim about the management cash outflow.
The report says non-cash bridge entries can include conversions, non-cash reinvestment, escrow arrangements and cut-offs, and that June 2026 non-cash entries mainly reflect cut-offs. That explanation does not allocate the full difference between the two statements. The reconciliation should stop at their published definitions rather than invent an adjustment that makes them identical.
A growing balance is also different from a return
The same distinction applies to performance. The presentation reports Private Funds value creation of 16.1%, or 13.0% excluding foreign exchange. These are Sofina's disclosed alternative performance measures, rather than the percentage change between the opening and closing fund balances.
Under the report's definition on page 56, value creation adds divestments and revenues to ending fair value, divides by opening fair value plus investments, and subtracts one. The measure excludes shareholder-level effects such as dividends or management expenses. Raw balance growth includes additional investment entries; using it as a return would mix capital added with value generated. The disclosed APM is also a different measure from an investor's cash-flow-timed IRR.
€1.449 billion is the remaining obligation, not the half-year spend
The residual-commitment bridge on page 40 starts with €1.329 billion of Private Funds commitments outstanding at the beginning of the period. The reported movements, in rounded millions of euros, are:
- €475 million of new commitments increases the stock.
- €407 million of investments reduces the stock.
- €12 million of other movements and €40 million of foreign-exchange impact increase it.
- The resulting closing stock is €1.449 billion.
Outstanding fund commitments therefore rose by €120 million even while investments reduced them. The €475 million of new commitments and the €407 million reduction answer different questions about activity; neither can be added to the closing €1.449 billion and described as cash deployed during the half-year.
The report's other-movements category mainly comprises recallable distributions, disposals and termination of funds with residual uncalled commitments. It separately discloses €7 million of residual commitments relating to Sofina Direct, bringing total uncalled commitments across the two investment styles to €1.456 billion. The €1.449 billion fund figure should retain its narrower label.
For fundraising teams, the remaining obligations provide context for future calls on existing relationships. They do not disclose a new mandate open to competing GPs or a timetable requiring the whole amount to be funded immediately. That distinction between an authorization and its eventual funding also matters in institutional pension commitment records.
The obligation mix differs from the existing portfolio
The strategy split on page 42 reports investment amounts alongside published percentage weights. Venture capital accounts for €4.494 billion, or 75%, of Private Funds fair value, but €846 million, or 58%, of residual commitments. Growth equity accounts for €1.274 billion, or 22%, of fair value and €526 million, or 36%, of residual commitments.
The comparison describes two denominators at the same reporting date. It does not establish a newly adopted allocation policy or predict where Sofina will make its next commitment. For an analyst considering future cash calls, however, the outstanding-obligation mix is more relevant than assuming those calls will reproduce the current fair-value weights. Existing marks and remaining funding obligations need not have the same strategy distribution.
Direct exposure still requires an ownership denominator
Sofina Direct and Private Funds are investment-style categories. The report's syndication-vehicle table on page 32 illustrates why the Direct label does not always mean an investment is held without an intermediary. It lists Peak XV Partners SB Series F, associated with Supabase, as a 2026 investment, with 60.00% ownership in the intermediary vehicle and 0.29% ownership in the underlying investment.
The two percentages describe different entities. The report presents these fully diluted interests as economic exposure, rather than voting or corporate rights. Reading the 60% as ownership or control of Supabase would substitute the intermediary denominator for the underlying company. The same discipline applies when comparing private-capital fundraising amounts: the definition attached to the number determines what can be compared.
Valuation dates and company-detail dates are separate
There is a final timing distinction within the fund portfolio. The valuation note on page 34 uses GP reports received through August 20 and says more than 81% of Private Funds fair value is based on June 30 reports or on market or transaction prices. March 31 GP values are adjusted for subsequent calls, distributions, listed prices and significant events through June 30.
The detailed underlying-company top-ten disclosure follows a different reporting constraint. It uses sufficiently detailed GP reports received through August 19, typically dated December 31, 2025 or March 31, 2026. Those company-level rankings therefore cannot be treated as a fully current list of new Sofina investments, while their lag should not be applied indiscriminately to the entire fund valuation.


See the allocators behind your next close.
Public records carry source-specific dates where available. No population-wide measured refresh cadence or universal verification deadline is established here. Page modified, source captured, fact observed, entity verified and aggregate measured describe different events. Check the date attached to the relevant claim; a missing verification date means unknown. Stored source history does not establish a customer-facing historical-analysis interface.